Statistics Regulator, Emily Carless explores the work done to communicate data on Covid-19 publicly, from inside and outside the official statistics system, supporting an army of armchair epidemiologists.
In 2020, our director Ed Humpherson blogged about the growing phenomenon of the armchair epidemiologist. Well, during the pandemic I became an armchair epidemiologist too. Or maybe a sofa statistical story seeker as I don’t have an armchair! Even though I lead our Children, Education and Skills domain rather than working on health statistics, I couldn’t help but pay close attention to the statistics and what they could tell me about the pandemic
At the micro-level I was looking at the dashboards on a near daily basis to understand the risks to myself, my family, my friends and my colleagues. I was watching the numbers of cases and hospitalisations avidly and looking at the rates in the local areas of importance to me. I felt anxious when the area where my step-sister lives was one of the first to go the new darkest colour shortly before Christmas 2021, particularly as my dad and step-mum would be visiting there soon afterwards. Earlier in the pandemic, once we were allowed to meet up, my mum and I had used these numbers to inform when we felt comfortable going for a walk together and when we felt it was better to stay away for a while to reduce the risk of transmission. These statistics were informing real world decisions for us.
At a macro-level I was also very interested in the stories the statistics were telling about the pandemic at a population level. The graphs on the dashboards were doing a great job of telling high level stories but I was also drawn to the wealth of additional analysis that was being produced by third parties on twitter. My feed was full of amazing visualisations that were providing additional insight beyond that which the statistical teams in official statistics producer organisations had the resources to produce.
As we highlighted in our recent State of the Statistical System report, the COVID-19 dashboard has remained a source of good practice. The dashboard won our Statistical Excellence in Trustworthiness, Quality and Value Award 2022. The ability for others to easily download the data from the COVID-19 dashboard to produce visualisations and bring further insight has been a key strength. I wanted to write this blog to further highlight the benefits of making data available for this type of re-use. I think Clare Griffith’s (lead for UK COVID-19 dashboard) tweet back in February sums it up perfectly. In response to one of the third-party twitter threads she said ‘Stonking use of dashboard data to add value. Shows what can be done by not trying to do everything ourselves but making open data available to everyone.’
Here are a couple of my favourite visualisations (reproduced with permission).
Like Clare, I really like Colin Angus’ (@VictimOfMaths) tapestry by age. It shows the proportion of confirmed Covid-19 cases in England by age group and how that changed during the pandemic. I also liked the way the twitter thread explained the stories within the data and that they made the code available for others. 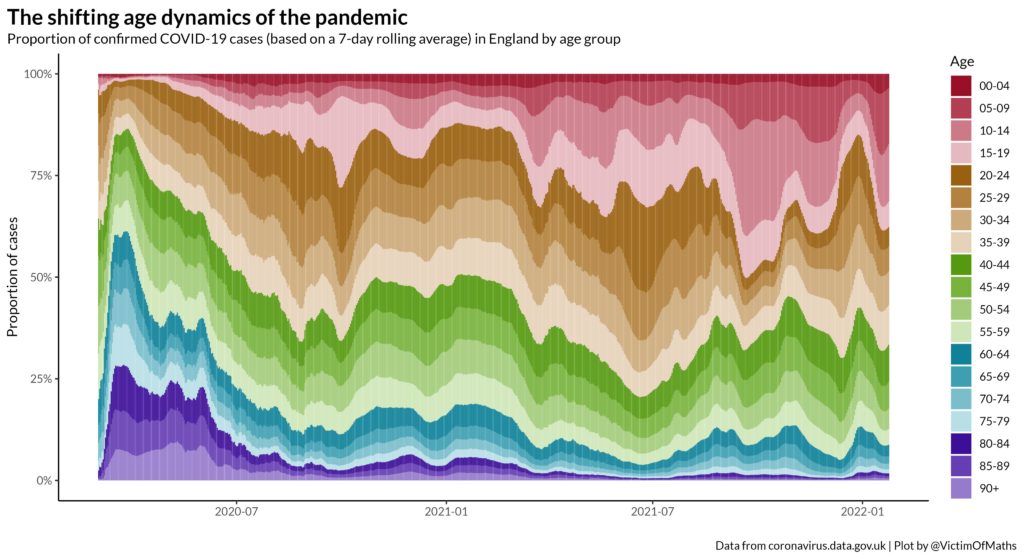
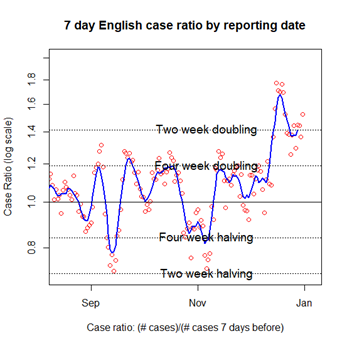
I also liked Oliver Johnson’s (@BristOliver) case ratio (logscale) plots. Although the concept behind them may have been complex, they told you what was happening with cases/ hospitalisations. The plot shows the 7-day English case ratio by reporting date on a log scale using horizontal lines to show where the case ratio showed a two or four week doubling or halving.
There was great work being done to communicate data on Covid-19 publicly from outside the official statistics system, supporting an army of armchair epidemiologists. This demonstrates the changing statistical landscape of increased commentary around official statistics, which we referenced in the latest State of the Statistical System report, at its best. Much of this was made possible by the Covid-19 dashboard team making the data available to download in an open format through an API with good explanations and engaging on social media to form a community around those data. We hope that this approach can be replicated in other topic areas to maximise the use of data for the public good.