Dear Mr Humpherson,
I am writing because I am concerned about the misuse of Ofsted statistics by the Department for Education and by the Secretary of State for Education Gillian Keegan, both in a press release and on social media.
In a press release titled “First step towards introducing the Advanced British Standard” and in a post on Gillian Keegan’s account on X (formerly Twitter), the DfE and Gillian Keegan claimed “89% of schools being rated good or outstanding by Ofsted, up from just 68% in 2010” and “89% of schools are now rated good or outstanding, up from just 68% under Labour”, respectively.
This statistic is misleading, as it suggests to the reader that school level Ofsted ratings are comparable between these two time periods. Due to changes in the school inspection framework, there is a substantial difference in the meaning of a ‘good or outstanding’ school in this period. Suggesting that these statistics are comparable is a violation of several of the principles of the Code of Practice for statistics, including T3.8, which requires that policy, press, and ministerial statements meet basic professional standards of statistical presentation, and several points of the quality and value pillars, including Q1.4, Q1.5, Q1.7, Q3.3, and V3.2, which concern the comparability of statistics.
The statistics which these statements refer to were reported by Ofsted in the annual reports for 2010 and 2023 and refer to the proportion of schools rated good or outstanding at their last inspection as of August 31st of each year. Between 2010 and 2023 there have been several changes to the inspection framework; the most notable was in September 2012 under the coalition government. This introduced the current system of judgements where schools are rated from 1 to 4, with the grades corresponding to ‘Outstanding’, ‘Good’, ‘Requires Improvement’, and ‘Inadequate’. Prior to this change, the grades corresponded to ‘Outstanding’, ‘Good’, ‘Satisfactory’, and ‘Inadequate’.
This change led to a redefinition of the second and third categories; while the second category retained the ‘Good’ descriptor, the actual criteria to meet this category changed due to the reclassification of ‘Satisfactory’ to ‘Requires Improvement’.
The impact of these changes can be demonstrated by comparing Ofsted grade descriptions for inspections from January 2012 to those for inspections from September 2012. Prior to the framework change, the 3 (satisfactory) grade descriptor for overall effectiveness included details on several areas of school performance and was similar in length to the descriptors for good and outstanding schools. It read, in part: “pupils and groups of pupils have a generally positive experience at school and are not disadvantaged as they move on to the next stage of their education, training, or employment”.
The September 2012 description of a grade 3 “requires improvement” school was simply: “The school requires improvement because one or more of the four key judgements requires improvement (grade 3) and/or there are weaknesses in the overall provision for the pupils’ spiritual, moral, social, and cultural development”. Within the individual key judgements, the ‘requires improvement’ grade description is that a given area “requires improvement as it is not good”, but does not provide further detail, with the one exception in leadership and management: “Leadership and/or management require improvement because they are not good but are demonstrating the capacity to secure improvement in the school”.
The good, outstanding, and inadequate descriptions are more detailed. In some cases, the description for a good grade in September 2012 overlaps with the description for a satisfactory grade in the January 2012 document. In at least one instance standards for a September 2012 good school are lower than those of a January 2012 satisfactory school. In the September 2012 document a good grade for pupil attainment requires that “Taking account of their different starting points, the proportions of pupils making and exceeding expected progress compare favourably with national figures. Where the proportion making expected progress overall is lower than that found nationally, it is improving over a sustained period”, while in January 2012, even a satisfactory grade required that “Pupils are progressing at least as well as all pupils nationally given their starting points.” Similarly, in January, a satisfactory description read that “In exceptional circumstances, where attainment, including attainment in reading in primary schools, is low overall, it is improving over a sustained period”, while a good description in September 2012 made no mention of this being exceptional and simply read “Where attainment, including attainment in reading in primary schools, is low overall, it is improving at a faster rate than nationally, over a sustained period”. Obviously, in this case, elements of the previous good and satisfactory descriptors have been combined to create a new, broader good category, while the new requires improvement category is simply characterised as lacking good traits. This leads to the classification of schools that would be graded satisfactory under the previous framework to be graded good under the new framework, inflating the proportion of good schools.
This is evidenced by the graph below, which was compiled from two sources of Ofsted data on the proportion of schools at each grade level at their most recent inspection as of 31 August of a given year.
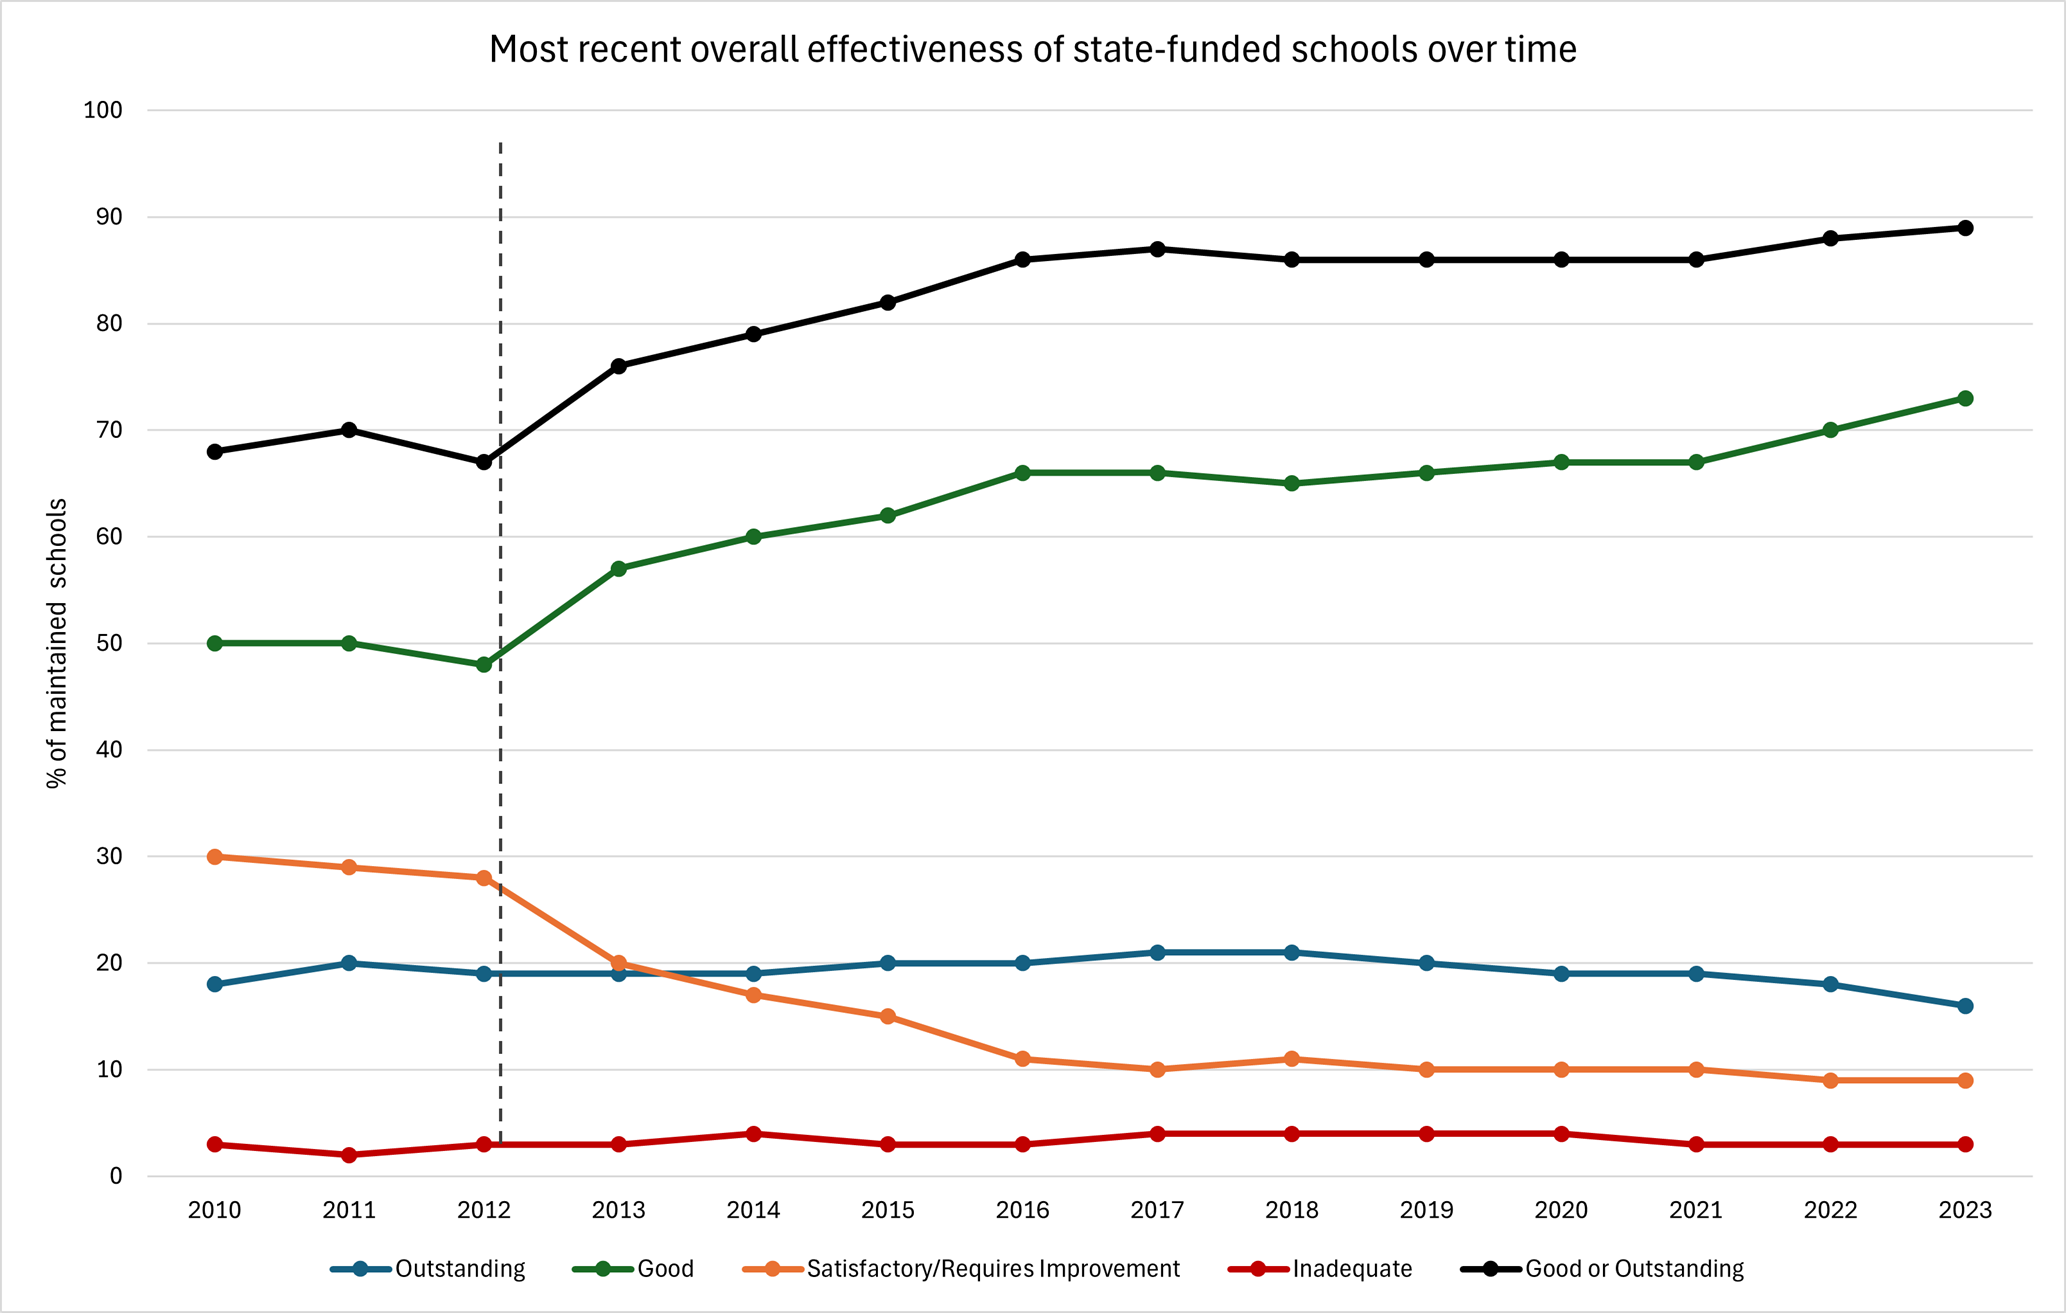
The increase in the proportion of schools rated good or outstanding between 2010 and 2023 is primarily due to an increase in the proportion of schools rated good and decrease in schools rated requires improvement between 2012 and 2016, corresponding to the adoption of ‘requires improvement’ as opposed to ‘satisfactory’ as the grade 3 descriptor for overall effectiveness. This shift took several years to become fully evident as not all schools are inspected each year; depending on their previous grading and a risk assessment, they are generally reinspected every 2-5 years. Once most schools had been inspected under the new framework, around 2016, the proportion of schools rated good or outstanding remained relatively stable. Throughout the period of interest, the proportion of schools judged inadequate remains virtually unchanged at 2 – 4 %. The proportion of schools judged outstanding also remains largely stable at about 20%, although in recent years this proportion has fallen to 16% after the policy of exempting outstanding schools from reinspection was ended. This has corresponded with a slight increase in the proportion of schools graded good, but little impact is evident in the proportion of schools rated requires improvement or inadequate.
This provides additional support for the argument that the increase in the proportion of ‘good or outstanding schools’ is because the meaning of ‘good’ changed in 2012 rather than because of “our fantastic teachers and the evidence-based reforms we’ve taken”, as Gillian Keegan claims in her post on X. She goes on to claim that the conservative government is “delivering high and rising standards in our schools”. This evidence suggests that, in the case of ‘good’ schools, the government has in fact lowered, not raised, standards, thus artificially inflating the proportion of schools rated good or outstanding. I therefore request that you investigate these statements and provide guidance on whether they are misleading, and whether Ofsted statistics of this sort can be compared over time.
Yours sincerely
General secretary
National Education Union