Recent seasonal trends in GDP
Recently published ONS assessments found that there was no statistically significant residual seasonality in quarterly (or monthly) GDP data. However, in all seasonal adjustment there is a risk of emerging signals, where the run of data is not yet sufficiently long to undertake robust statistical tests. Thus, in the short term the series could still show some emerging residual seasonality that does not yet reach statistical significance at the conventional levels.
This possibility seems particularly worthy of attention as the ONS assessment included statistical tests run over the most recent five years. These spanned highly variable periods – notably the pandemic, its aftermath and a subsequent “new normal”, where economic relationships have changed substantially from the pre-pandemic period, for example due to increased “remote” activity.
Chart 1 shows the first estimate for mean quarterly GDP growth for each quarter in the six years prior to the period affected by the pandemic and for the most recent quarters, where the immediate effects of the pandemic have abated (although the impact of other shocks, such as those affecting energy prices, will remain).
First-release, rather than revised, estimates are shown as the first estimates are the focus of much attention from key stakeholders, including market participants.
It should be noted that there is no pretence that the simple descriptive statistics presented in Chart 1 and subsequent charts could support definitive conclusions – at most, they motivate the discussion and may prompt questions for further consideration.
Chart 1. First estimates of mean quarterly GDP growth (%).
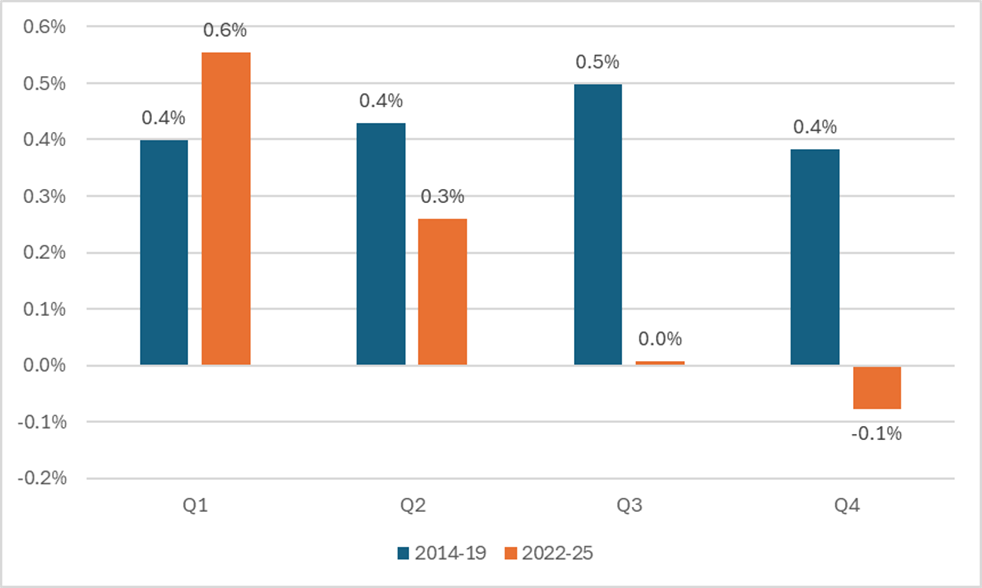
Consistent with the more sophisticated statistical assessment undertaken by ONS, the data in the chart show no obvious indication of any residual seasonality during the pre-pandemic period.
However, although the period covered is short, over the later period, 2022–25, the pattern is one of much higher growth in the first two quarters – particularly in the first quarter – than in the second half of the year. (The mean quarterly figures in Chart 1 mask a decreasing trend; a fuller presentation of the quarterly data, with a moving average, is shown for each period in Charts A1 and A2 in the Annex.)
As previously noted, this purely correlational evidence of residual seasonality is not supported by ONS’s statistical testing (albeit the nature of these tests may mean that a longer run of data is required to assess statistical significance).
Further exploration of this recent pattern seems warranted, particularly given the known challenges of identifying changes in seasonality in real time.
At the time of the pandemic, ONS applied full concurrent seasonal adjustment, and over the period since, ONS has applied either full concurrent or partial concurrent seasonal adjustment alongside regularly monitoring and assessment of prior corrections each month and quarter. National Accounts then apply a revision policy, also published for transparency, to help manage revisions to published estimates.
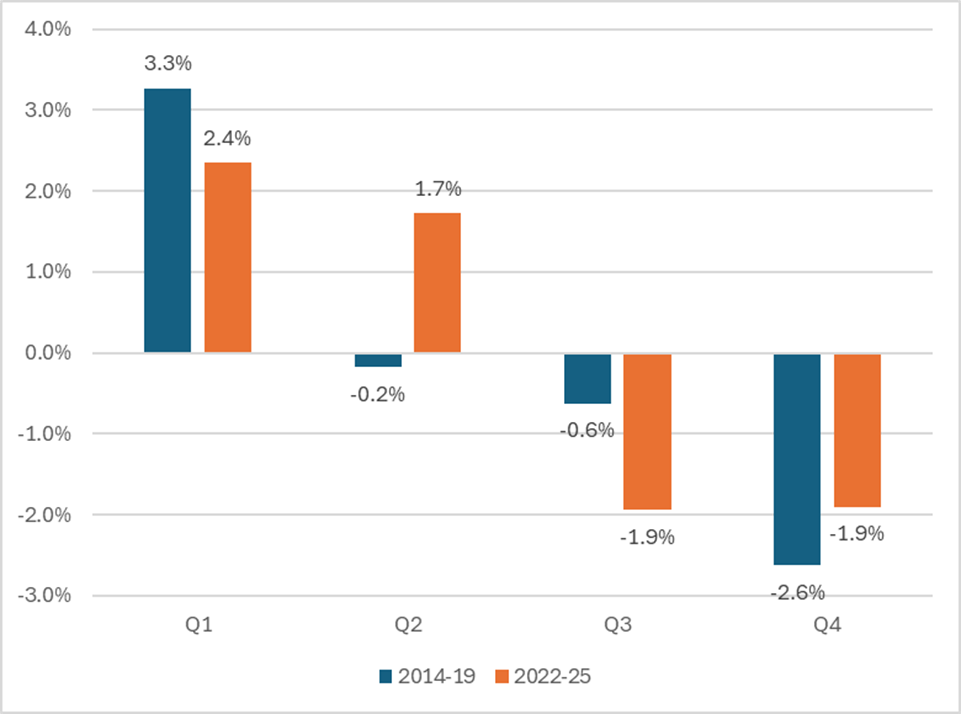
Chart 2 compares seasonally adjusted and unadjusted GDP data for the years prior to the pandemic and for the more recent period. The chart shows the difference between adjusted and unadjusted data in percentage terms. As the unadjusted data are only published for vintages incorporating revisions, the chart has been shown on this basis and is therefore on a different basis from Chart 1.
Chart 2 shows that the seasonal adjustment in the first quarter was smaller over the latter period than over the former. In other words, it appears that if the pre-2020 seasonal factors had been applied, then growth in the first quarter would have been even stronger (with growth in the second quarter reduced).
Chart 2. GDP chained volume, average seasonal adjustment (%).
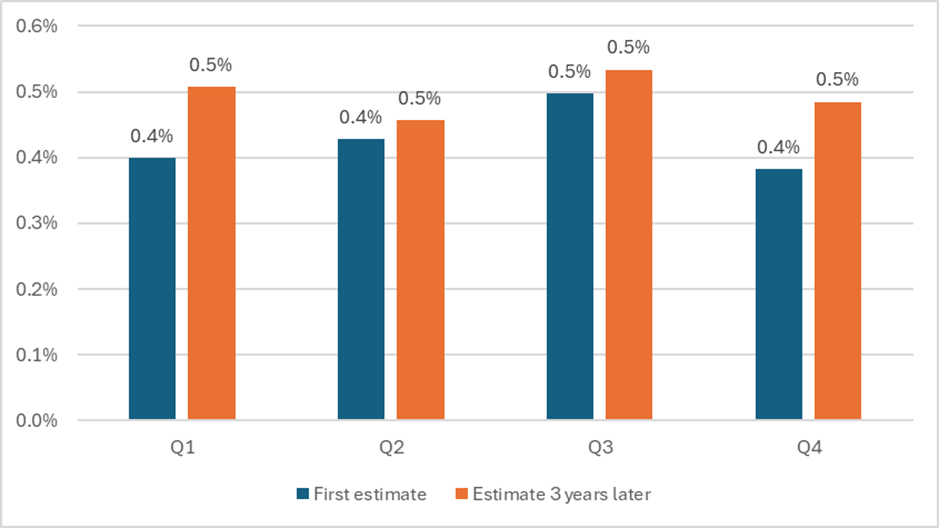
It is also important to consider whether the revisions process changes the story. Chart 3 shows, for 2014–19, both the first estimates and the values reported by ONS three years later. (Similar results cannot yet be presented for the post-pandemic period as a sufficient run of data is not available.) It is notable that each quarter has, on average, been revised up by around 0.1 percentage point, but there is no apparent seasonal pattern to the revisions. It will be important in due course to confirm this finding for the more recent period, and the issue of seasonality in revisions should be considered as part of ONS’s annual review of GDP revisions.
More generally, there is scope for ONS to publish more information on the presence, or absence, of statistically significant evidence of seasonal variation in revisions. Such seasonal variation could result in residual seasonality in the unrevised data in first releases, something which is not assessed as part of the regular assessment of seasonality (which considers only seasonality in specific vintages of data, which will include revised data for previous periods). Unrevised data in first releases play a crucial role in the decision making of some key stakeholders.
Chart 3. Mean quarterly GDP growth for 2014 to 2019 (%).
Non-official data could provide an alternative basis for assessing seasonal patterns in economic output and might therefore either tend to confirm trends revealed by official data or raise questions about their validity.
There are limited external data sources against which official GDP data can be compared. A prominent alternative indicator of overall economic performance is probably the output index from the composite S&P Global Purchasing Managers’ Index (PMI). This indictor reflects the balance of responses to a binary question about whether output has expanded or contracted over the period in question. (It is therefore a so-called “diffusion index”.) A figure of over 50 indicates expansion. The results are seasonally adjusted directly, in contrast with ONS’s indirect approach with GDP.
The PMIs are, inevitably, subject to methodological limitations, particularly sample sizes, and the fact that only the direction, and not the scale, of any change in output is reported.
Differences in methodology between the PMIs and official GDP mean both that results would be expected to be less than fully aligned, and any discrepancy between the series would not necessarily raise serious concerns about the robustness of the official data. It might, however, prompt questions.
In a 2019 article, ONS considered the relationship between the PMIs and monthly and quarterly GDP. It found that the PMIs show the strongest relationship with ONS three-month on three-month-a-year-ago data, with significant and sustained correlations found between the two datasets. The PMIs had no significant correlation with ONS month-on-month official estimates of growth or with indices computed from the Monthly Business Survey using the same approach to recording change as the PMIs.
The PMI data shown in Chart 4 suggest that, like the official GDP data, over the last few years (2022–25), economic output has grown more strongly in the first half of the year, and particularly in the first quarter.
Chart 4: PMI Headline Composite Index, quarterly averages.
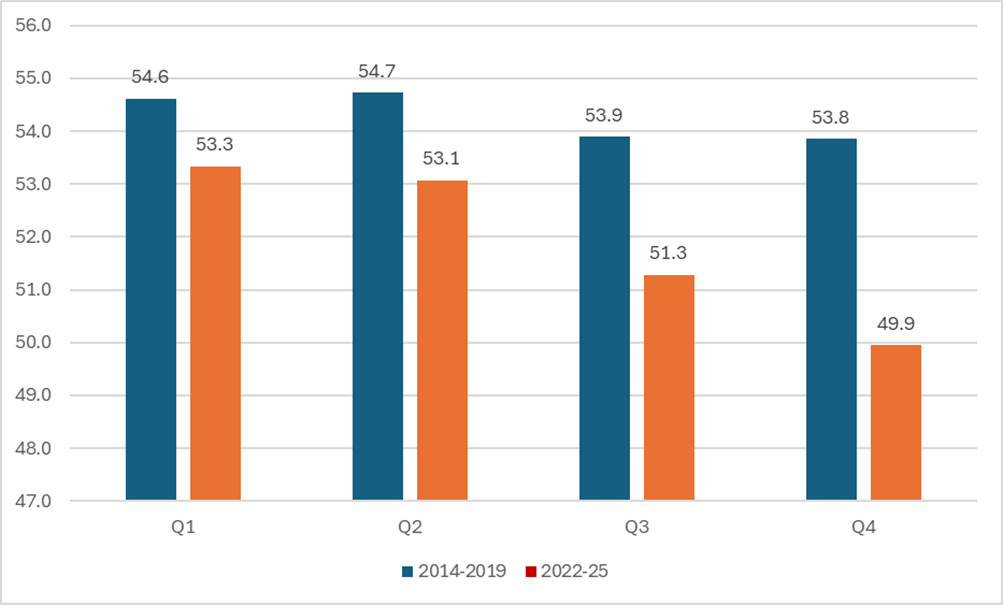
Source: S&P Global PMI. Data to Q3 2025.
ONS and independent commentators have pointed to specific one-off factors that may have affected the first quarter in recent years. These factors include the recovery from the pandemic and the associated restrictions in early 2022, along with activity being brought forward in anticipation of increased US tariffs in 2025.
In summary, the available descriptive and formal statistical tests do not indicate an issue of residual seasonality in the quarterly (or monthly) GDP data. This would be consistent with the results of ONS’s statistical testing for previous periods.
ONS could further increase reassurance by undertaking and publishing an analysis of the sources of the recent seasonal pattern through an investigation of the drivers within the component series.
Back to top