Annex B: Analysis of survey of Heads of Profession for Statistics/Chief Statisticians
Introduction
The aim of this survey was to gather the views from Head of Profession for Statistics and Chief Statisticians on what about intelligent transparency works well within their departments, what barriers remain and what processes departments have in place to support intelligent transparency. The survey ran from 20 February 2025 to 28 March 2025.
We had a good response rate, with 18 out of 20 departments in scope responding, including each of the devolved governments. Though two departments did not respond to the survey, their views were captured in follow-up interviews as part of the wider stakeholder engagement for this review.
Methodology
The survey included 13 questions and was presented in five sections:
- Your experiences of Intelligent Transparency
- Support for Intelligent Transparency
- Your barriers to Intelligent Transparency
- Future OSR Work
- Additional information
The results below have been organised under these sections. There were three types of questions in the survey: single choice, multiple choice and free text; the question type and whether the question was optional have been labelled in the results.
Single-select questions (mandatory)
As respondents were only able to choose one option per question, one count represents a single respondent. The options that the respondents were presented with are shown on the x axis of the bar charts. As each single-select question was mandatory, the sum of the bar values will equal the total number of respondents (18).
Multiple-select questions (mandatory)
As respondents were able to choose any combination of options for each question, the number of recorded selections can vary from question to question. The options that the respondents were presented with are shown on the y axis of the bar charts.
Free text (mandatory or optional)
Due to the nature of free-text questions, the responses have been represented as general summaries. In these summaries, we have identified common themes across all recorded responses. These data are qualitative, which means other common themes could have been missed during analysis of the responses. Full responses have not been included to avoid disclosing the identity of respondents.
Results
Your experiences of Intelligent Transparency
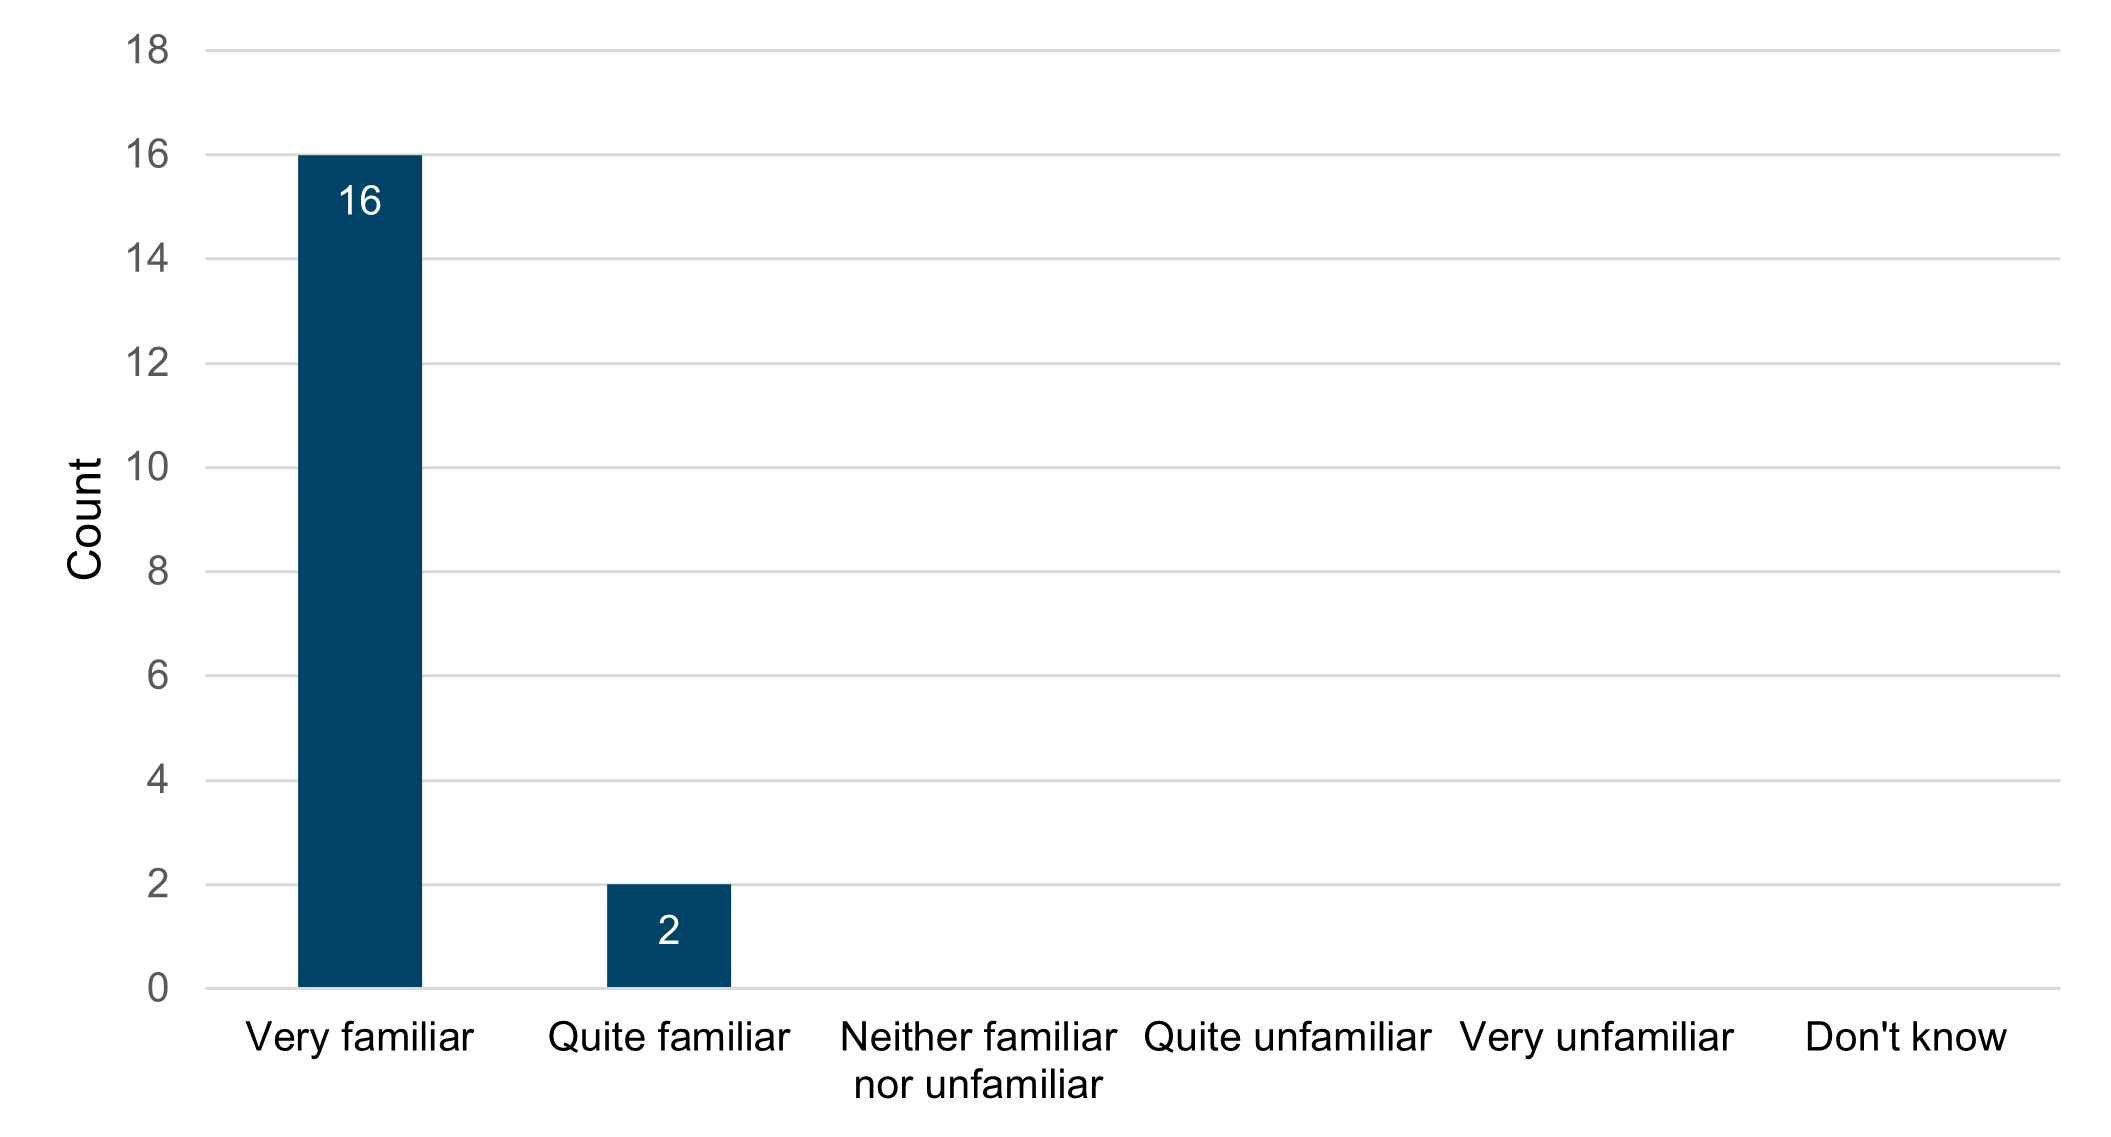
Question 1: How familiar or unfamiliar are you with the concept of Intelligent Transparency? (single select, mandatory)
All respondents reported being familiar with intelligent transparency, with 16 out of 18 respondents selecting “very familiar”.
Figure 4. How familiar or unfamiliar are you with the concept of intelligent transparency?
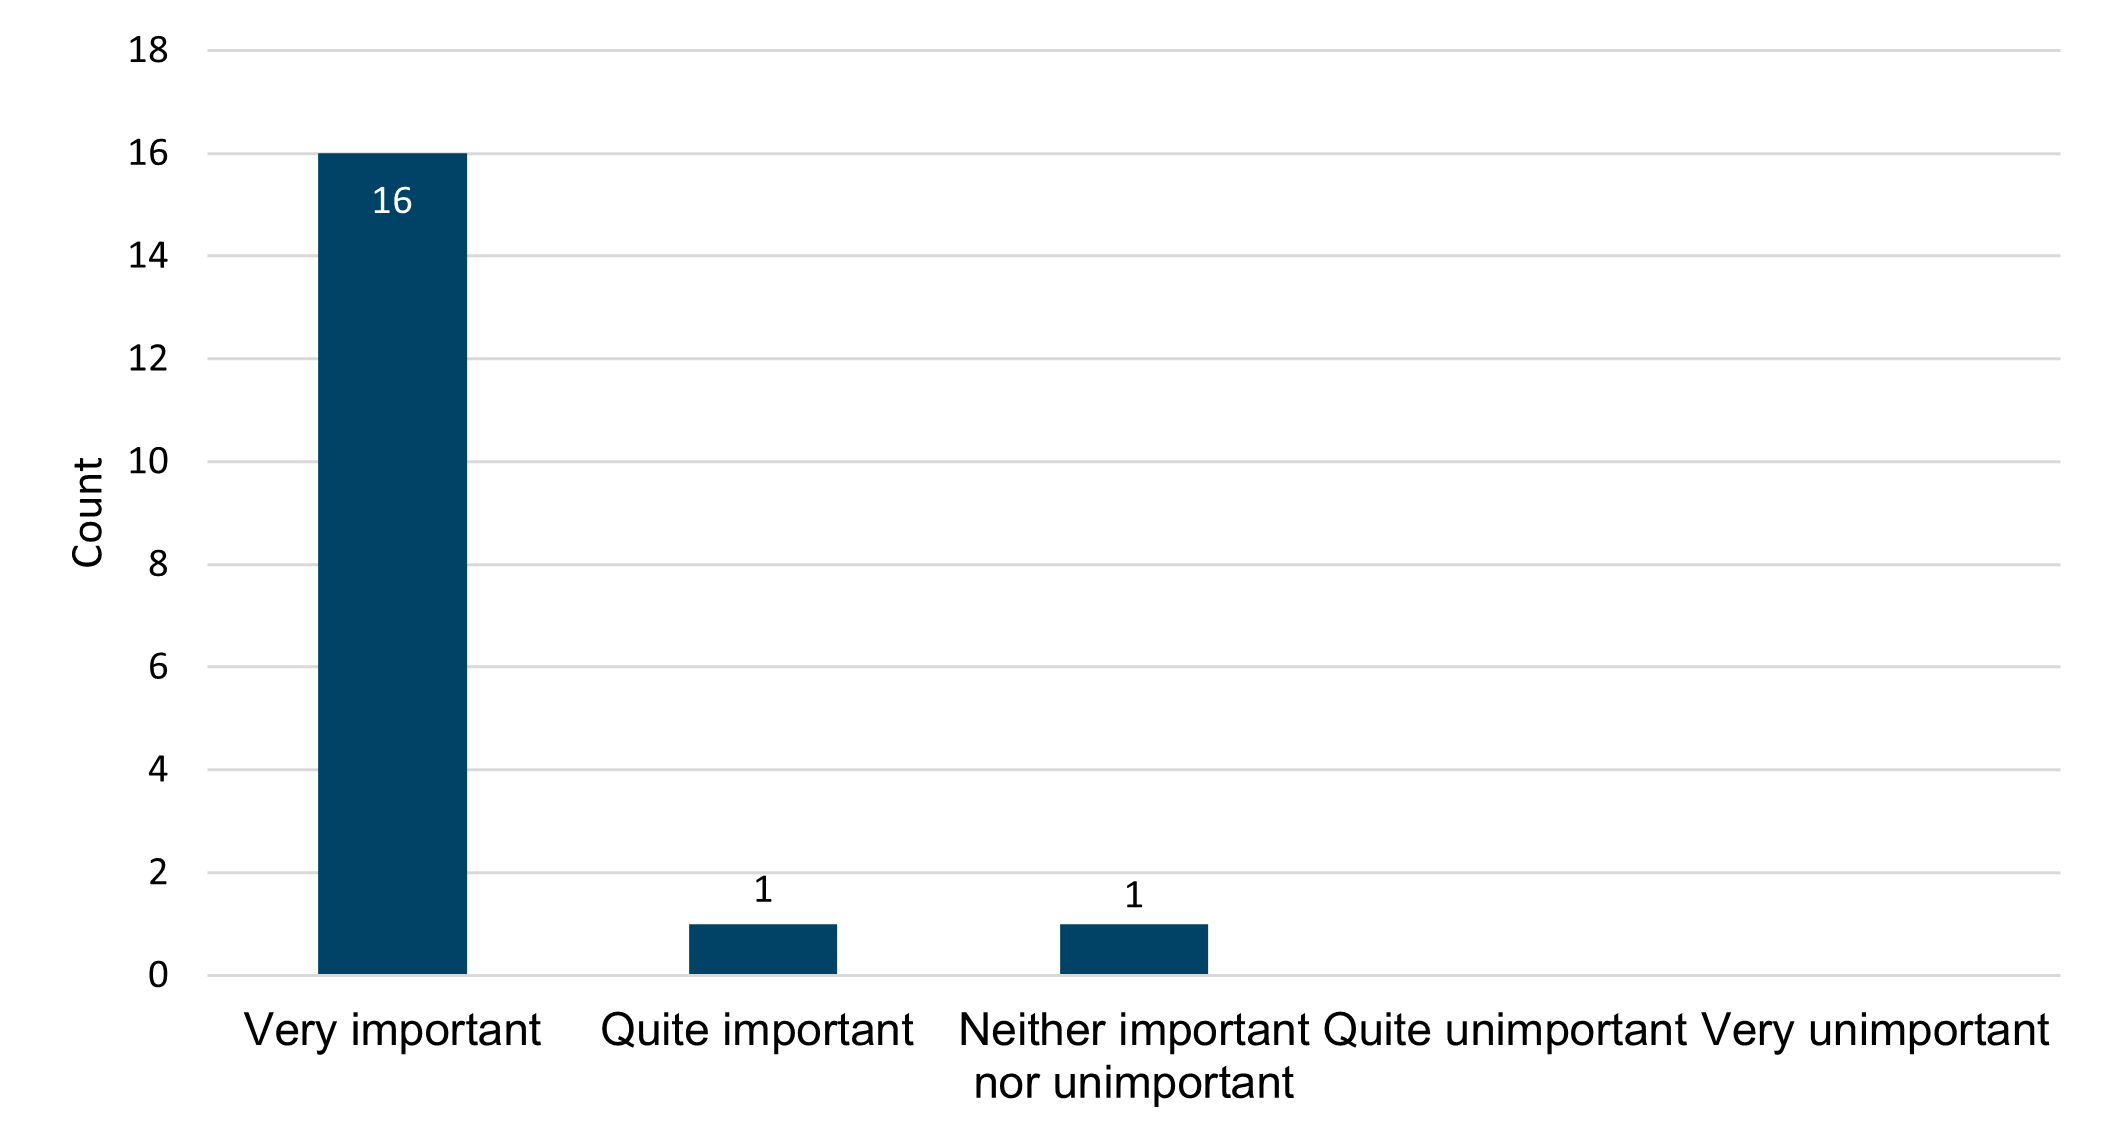
Question 2: How important or unimportant do you believe Intelligent Transparency is to supporting appropriate use of government data and statistics? (single select, mandatory)
Intelligent transparency appeared to be well understood among the Heads of Profession for Statistics and Chief Statisticians who responded to this survey. In addition, 16 respondents reported that they believe that intelligent transparency is “very important”, with no respondents indicating that they believe it is unimportant.
Figure 5. How important or unimportant do you believe Intelligent Transparency is to supporting appropriate use of government data and statistics?
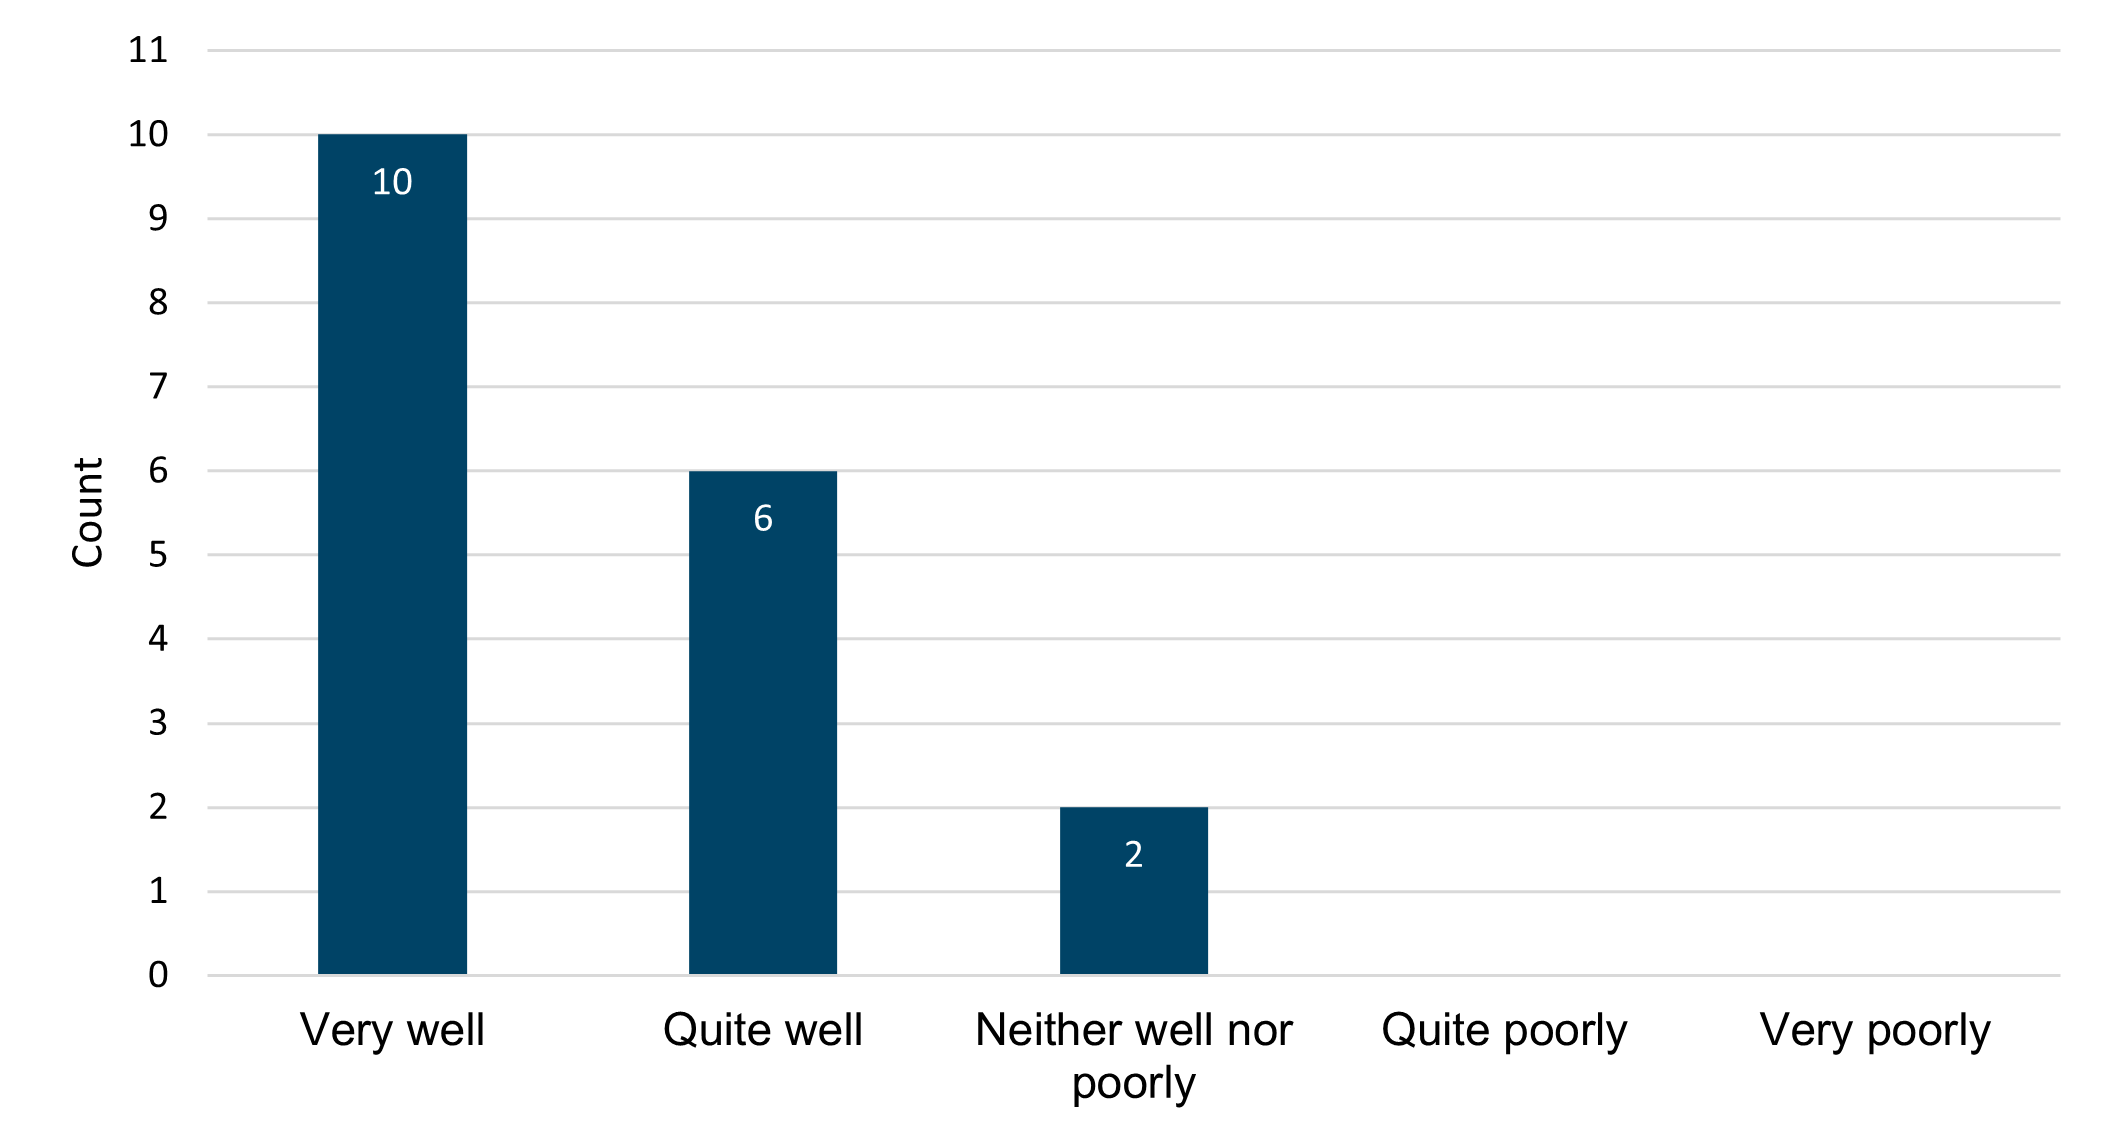
Question 3: In your experience, how well or poorly embedded are the principles of Intelligent Transparency with statisticians in your department? (single select, mandatory)
Most departments who provided a response described intelligent transparency as being well embedded among their statisticians, with 10 and 6 respondents selecting that the principles of intelligent transparency are “very well” and “quite well” embedded, respectively. Only two respondents indicated that intelligent transparency is embedded “neither well nor poorly” within their department.
Figure 6. How well or poorly embedded are the principles of Intelligent Transparency with statisticians in your department?
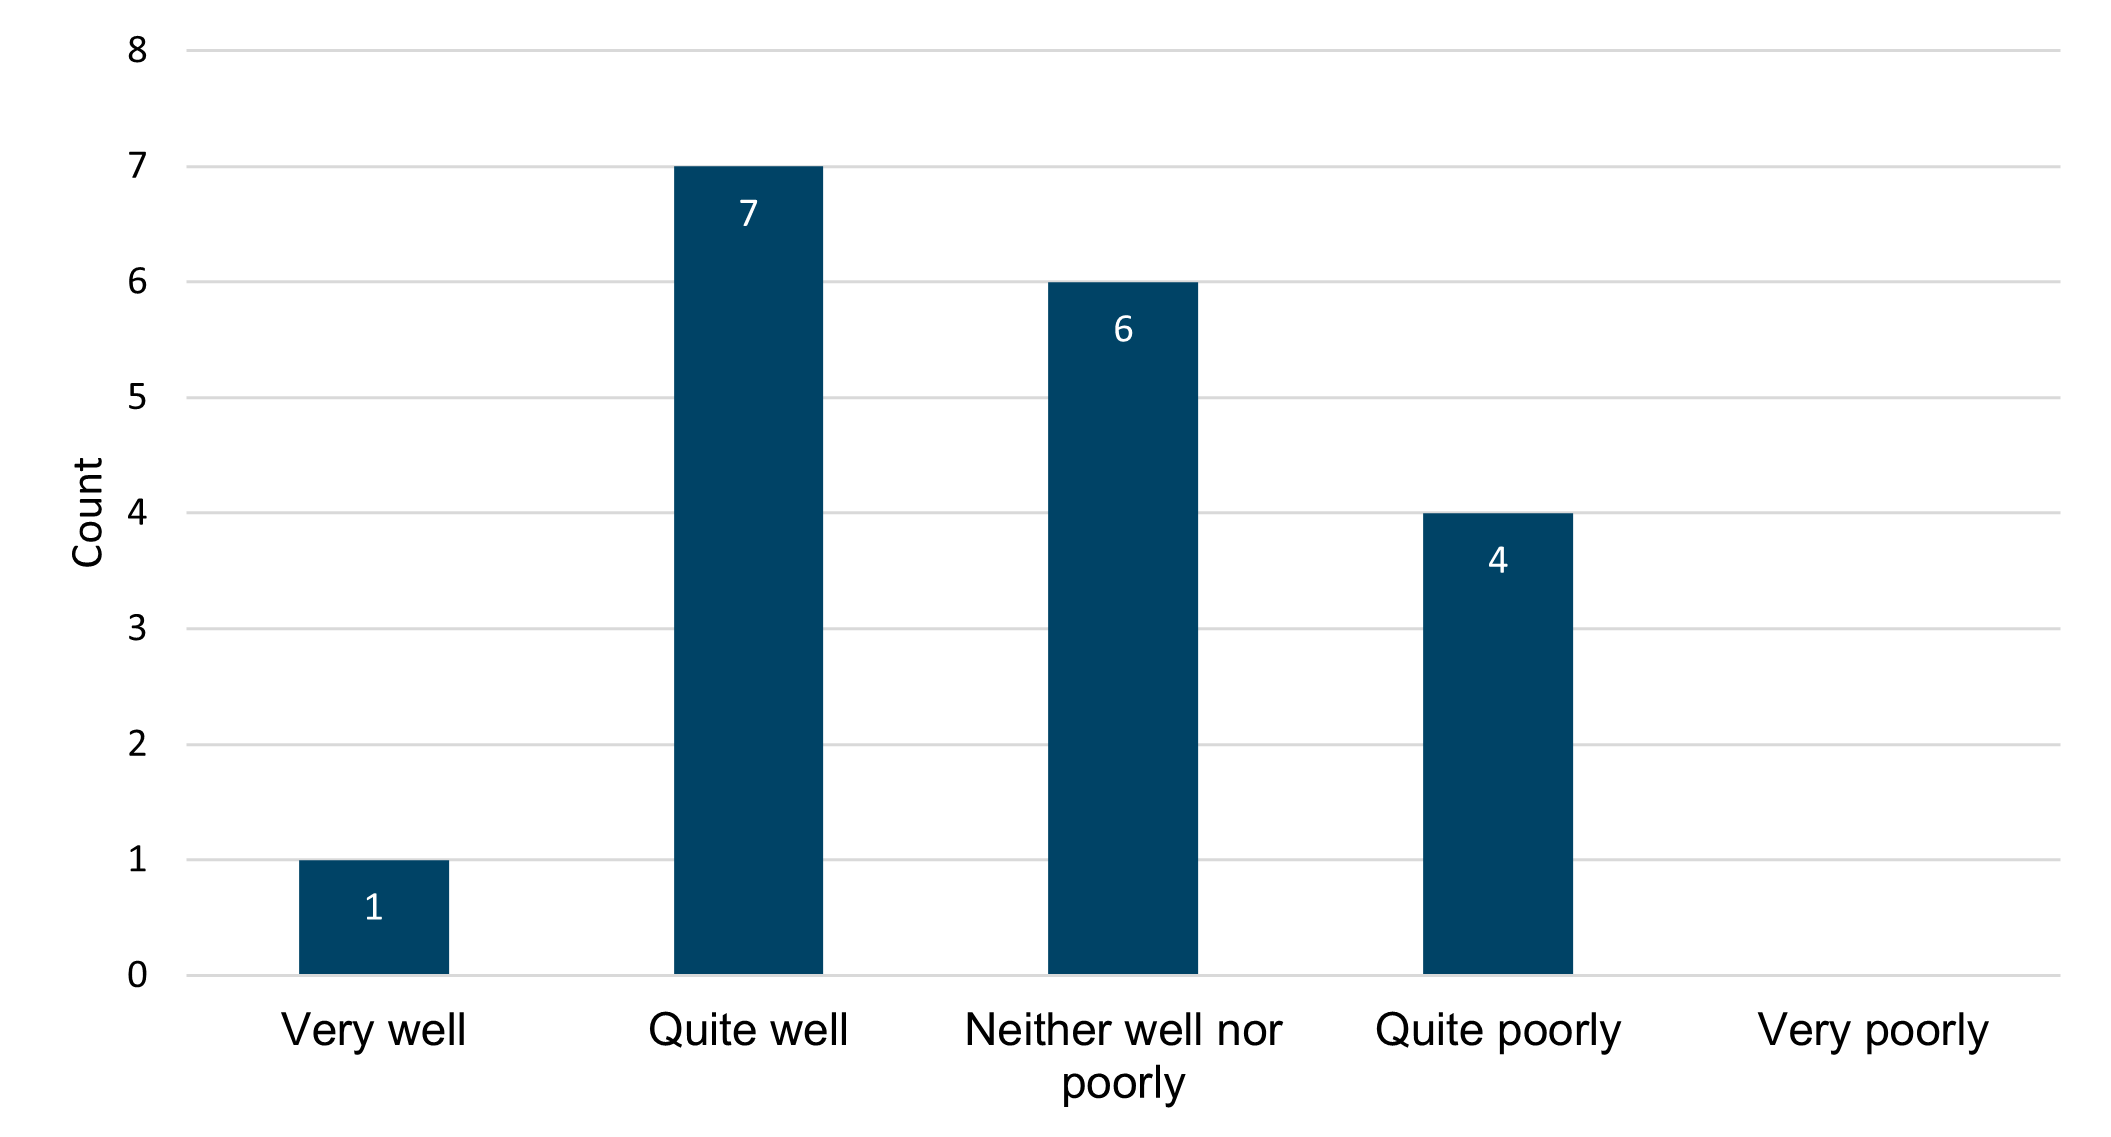
Question 4: In your experience, how well or poorly embedded are the principles of Intelligent Transparency in your wider department? (single select, mandatory)
Respondents were more mixed in terms of whether they indicated that they believe intelligent transparency is well embedded in their wider department (beyond statisticians). Responses varied from intelligent transparency being embedded “quite well” (7), to “neither well nor poorly” (6), to ”quite poorly” (4).
Figure 7. How well or poorly embedded are the principles of Intelligent Transparency in your wider department?
Support for Intelligent Transparency
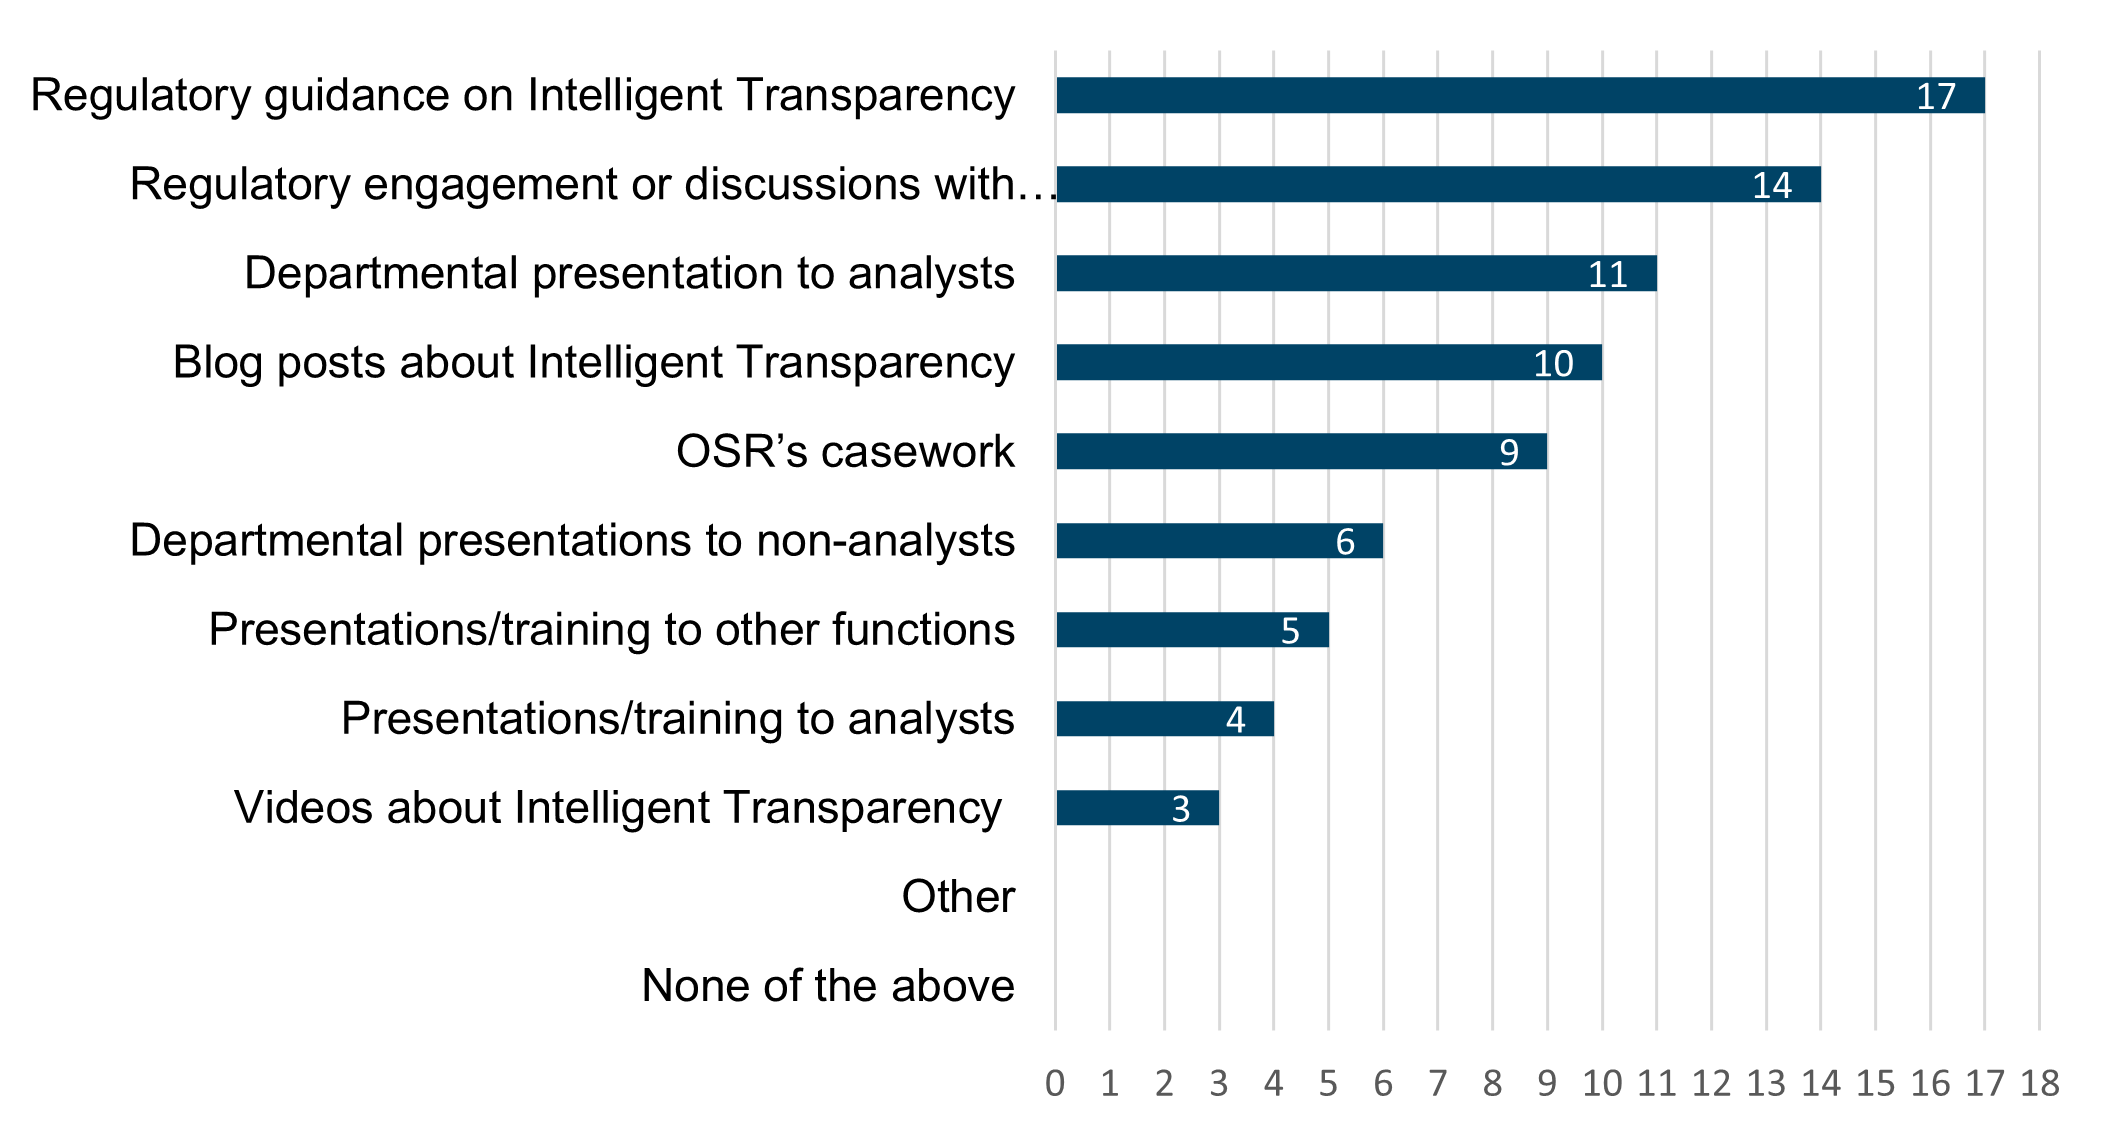
Question 5: OSR uses multiple approaches to support Intelligent Transparency. Which of the following OSR approaches have you and your department found helpful? Please select all that apply. (multiple select, mandatory)
Regarding OSR’s approaches to supporting intelligent transparency, 17 respondents indicated that they found regulatory guidance on intelligent transparency helpful. This was the most selected option amongst respondents. The next most common selection was discussions with OSR, which 14 respondents found helpful.
Blogs and OSR’s casework were also popular, with these options being chosen 10 and 9 times, respectively.
Only three respondents found videos on intelligent transparency helpful.
Figure 8. OSR uses multiple approaches to support Intelligent Transparency. Which of the following OSR approaches have you and your department found helpful?
Question 6: Some departments have additional resources, guidance and tools for Intelligent Transparency beyond what OSR provides. What support for Intelligent Transparency is available in your department? Please think of support both for members of your profession and beyond. (free text, mandatory)
Respondents described a variety of additional resources, guidance and tools that they used to support intelligent transparency beyond what OSR provides. Specific types of support mentioned included:
- presentations and sessions (including those targeted to all staff, as well as separate sessions targeted specifically at analysts and also non-analysts)
- guidance (such as on intranets or SharePoint, sometimes described as ‘extensive’)
- support from HoP office or a central statistics team
- a ‘control of statistics’ group, which included representatives from all analytical teams to monitor misuse of statistics
- external training (such as from Full Fact)
Not all respondents indicated that they had access additional support beyond what OSR offers, with some explicitly highlighting that there was no additional guidance or material available in their department.
Question 7: What other support from OSR, if any, would help you and your department with Intelligent Transparency? (free text, mandatory)
Respondents mentioned many ways in which OSR could further support departments with intelligent transparency. Specific types of support mentioned included:
- Wanting to see positive examples of intelligent transparency in practice. This has led us to reach out to departments to identify and develop the case studies included in this report.
- More help pushing intelligent transparency to senior levels within departments.
- Improving our regulatory guidance so that it is clearer and more consistent – we recently refreshed our guidance as part of the launch of the third edition of the Code of Practice for Statistics (the Code).
It was also reassuring to hear that several HoPs were happy with the current support from OSR and stated that they want to see this level of support continued.
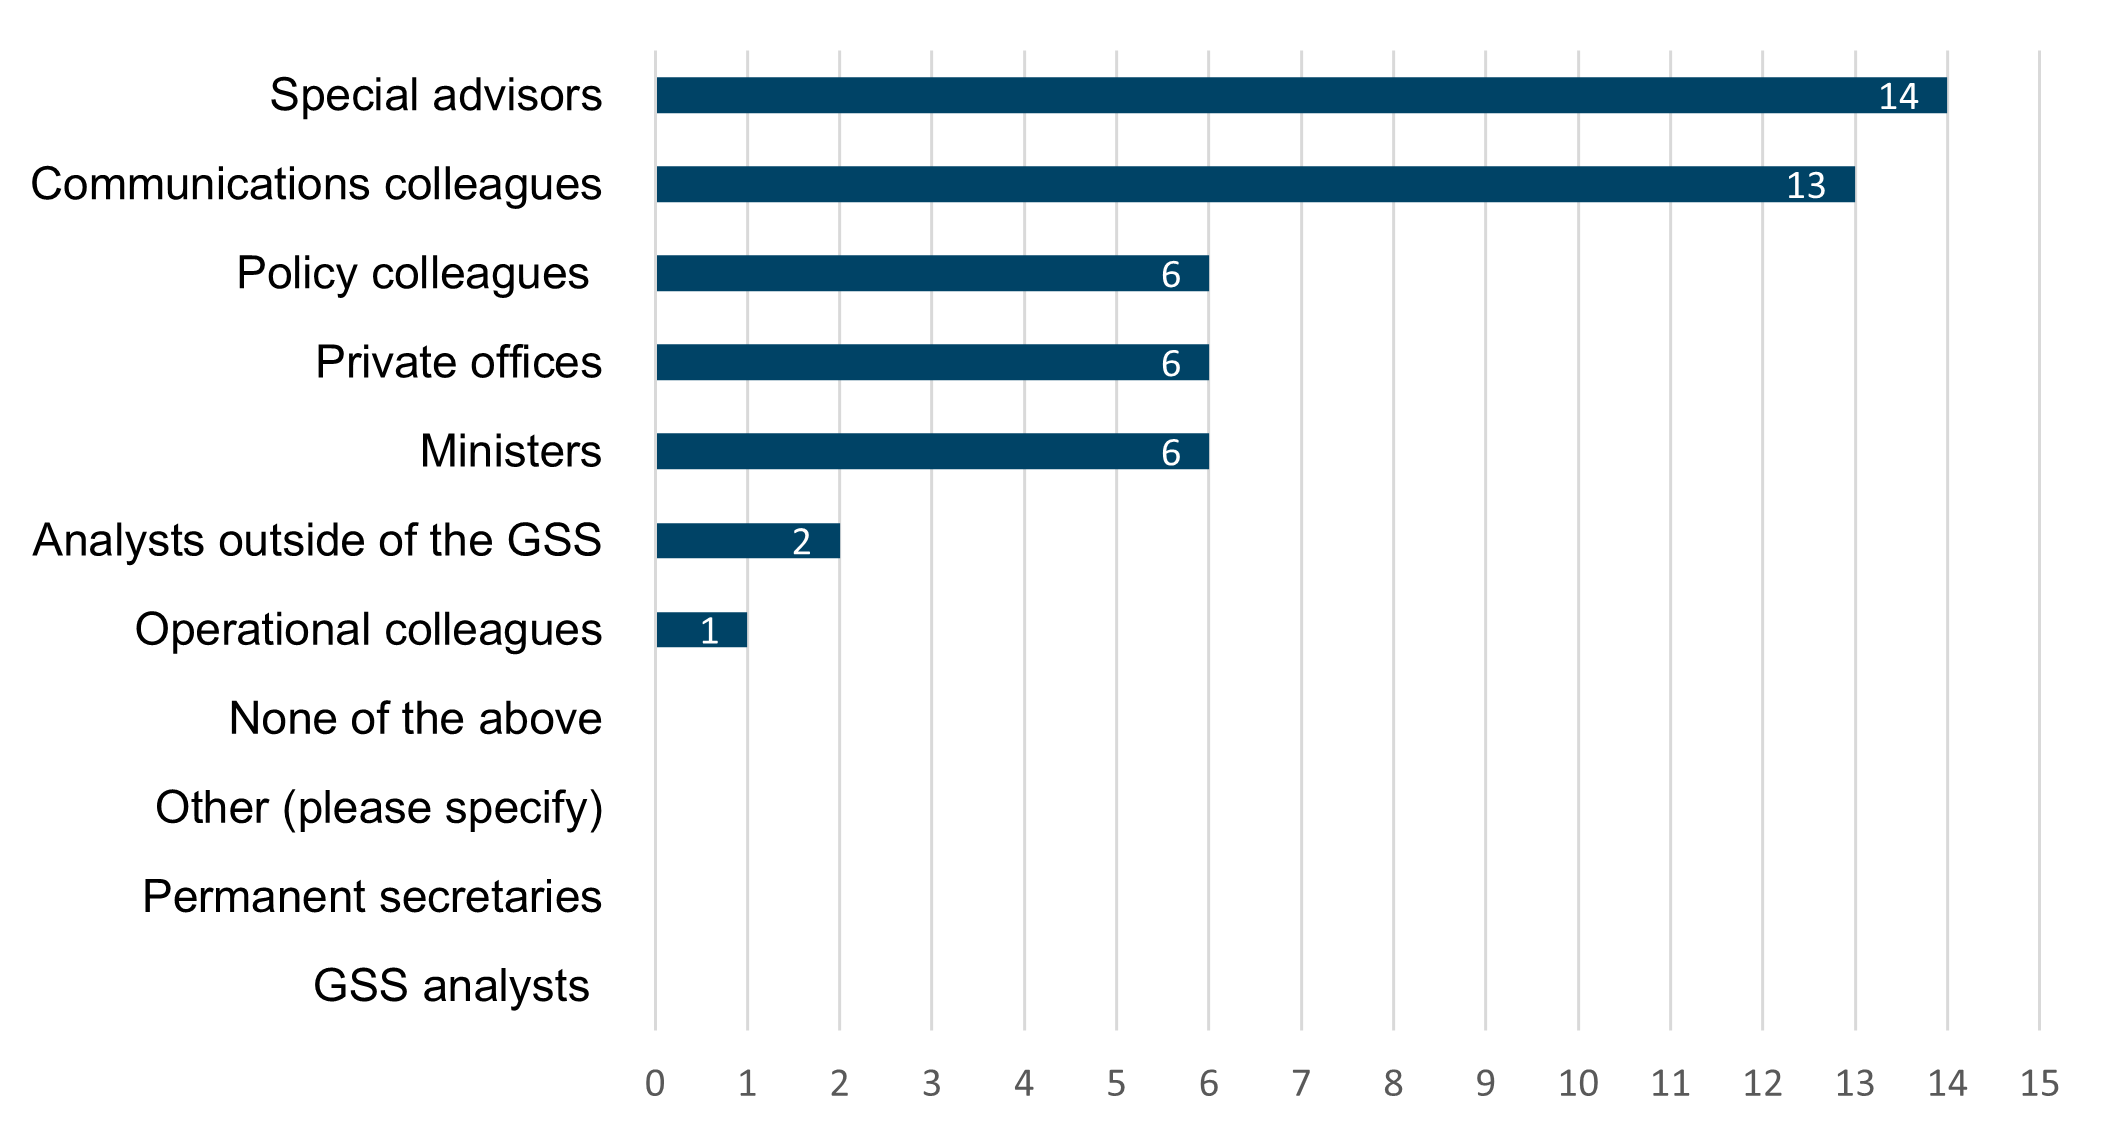
Question 8: In your department, which of the following groups do you believe require the most support with Intelligent Transparency? Please select up to three groups. (multiple select, mandatory)
- Responses to this survey describe special advisers and communications colleagues as the groups needing the most support with intelligent transparency. These options were chosen 14 and 13 times, respectively.
- Respondents also indicated that to improve the adoption of intelligent transparency, there needs to be more buy-in from special advisers, communication professionals, senior civil servants and ministers.
Figure 9. In your department, which of the following groups do you believe require the most support with Intelligent Transparency?
Your barriers to Intelligent Transparency
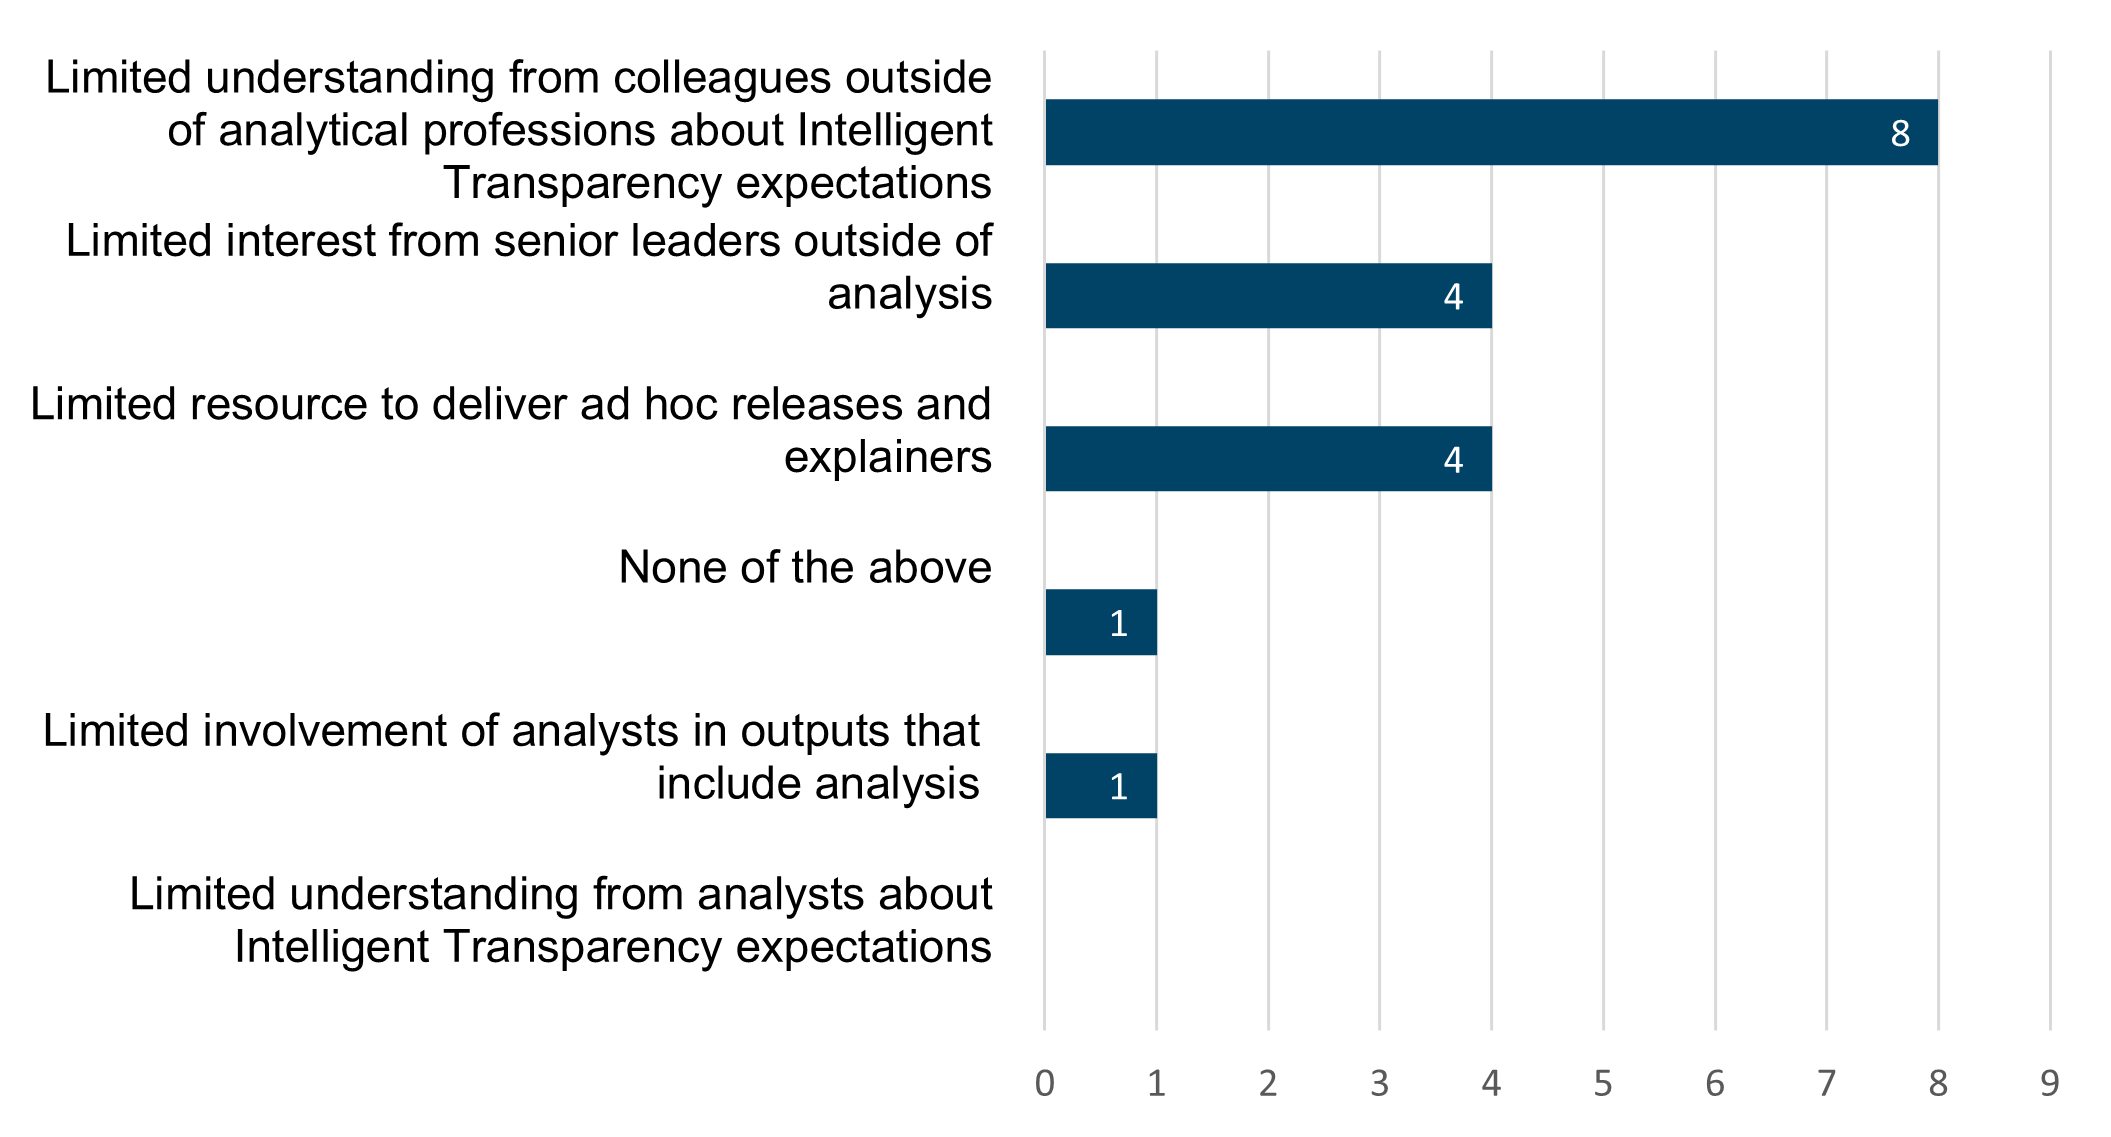
Question 9: Which of the following barriers to Intelligent Transparency does your department currently experience? You will have an opportunity to share additional barriers later in the survey. (multiple select, mandatory)
The most selected barriers to adhering to intelligent transparency were “limited understanding outside of analytical professions”, “limited interest from senior leaders” and “limited resource to produce ad hoc releases”. This aligns with the results in figure 9, showing that it is non-analytical colleagues whom respondents perceive as needing the most support. However, there was not a clear majority of respondents who all experience the same barrier, as only 8 out of 18 selected the most common response.
Figure 10. Which of the following barriers to Intelligent Transparency does your department currently experience?
Question 10: What other barriers to Intelligent Transparency, if any, does your department currently experience? Please think of barriers to both members of your profession and beyond. (free text, mandatory)
A large and diverse range of barriers to intelligent transparency were identified in the responses to this question. The types of barriers mentioned also varied between departments, highlighting that different departments are facing different challenges. Some barriers highlighted include:
- Resource implications for departments, especially departments with administrative data that are of interest to ministers. Some respondents indicated that they can struggle to meet the demand for ad hoc requests for statistics.
- Limited understanding of intelligent transparency and statisticians or analysts not being involved in all outputs that involve analysis.
- Cultural barriers that discourage transparency.
- The phrase ‘intelligent transparency’ not being intuitive and obvious in its meaning – for this reason we chose not use the phrase ‘intelligent transparency’ in the title of the new standards included in the third edition of the Code.
Future OSR Work
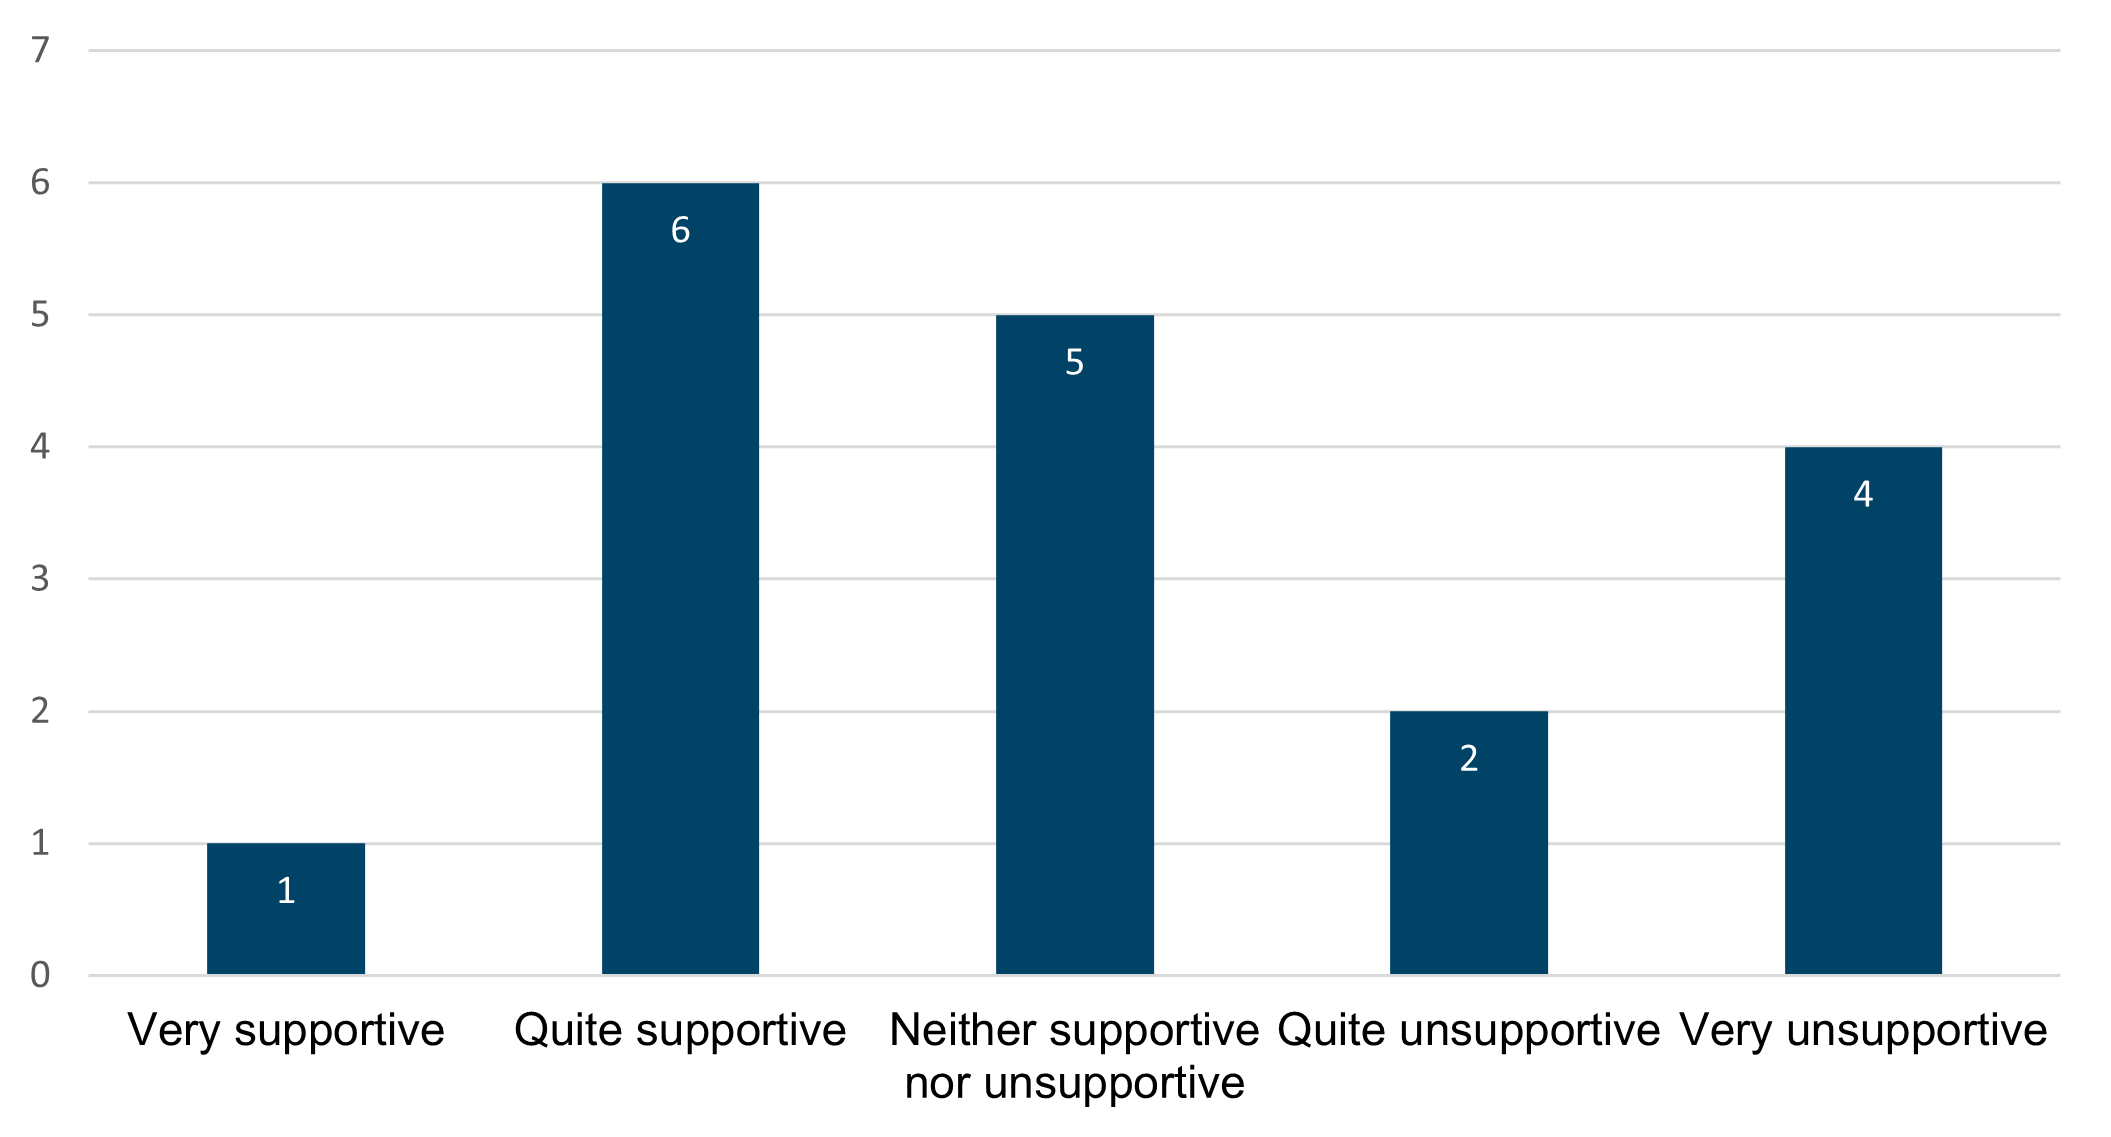
Question 11: How supportive or unsupportive would you be of OSR publishing an annual report card about your department? (single select, mandatory)
Respondents’ views on a potential intelligent transparency report card were very mixed. More respondents indicated that they were “very unsupportive” of the proposal than “very supportive”, with scores of four and one, respectively. However, “quite supportive” was the most popular answer, with a third of respondents indicating that they feel this way. Just under a third indicated that they are neither supportive nor unsupportive.
Figure 11. How supportive or unsupportive would you be of OSR publishing an annual report card about your department?
Question 12: If we published a report card about your department, what challenges or concerns, if any, would you like to make us aware of? (free text, optional)
Though this question was optional, 14 respondents chose to provide an answer. Respondents described a variety of challenges and concerns:
- Some respondents stated that they are worried about potential reputational damage that could be caused by the introduction of report cards.
- Concerns were raised about the resource demands of implementing intelligent transparency in relation to public gain.
- If report cards are implemented, some respondents indicated that they would like department-specific challenges and constraints to be recognised.
- There were general concerns around what the report card would look like or how arm’s length bodies would be included.
- From a department whose representative indicated it is supportive of report cards, the respondent mentioned that report cards could be a good way to drive up awareness of intelligent transparency.
Additional information
Question 13: We are grateful for your expertise in helping us understand and develop our Intelligent Transparency campaign. What other information, if anything, would you like to tell us about this topic? (free text, optional)
When asked for general thoughts, respondents indicated they would like guidance on intelligent transparency from OSR to be clearer or profession-specific. Some respondents also raised that the language of intelligent transparency should be changed. Another theme mentioned repeated previous comments about raising the profile of intelligent transparency with senior leaders.
Back to top