There has been much attention recently, in UK parliament and in the media for example, on the weekly number of deaths in the UK. In particular, there has been a high level of interest in understanding excess deaths – that is the number of deaths that occurred or had been registered during a certain period minus the number that would have been expected. Over the past weeks, months and years, these data have been important measures to help understand factors affecting people and society in this country including the COVID-19 pandemic and pressures on the NHS.
The Office for Statistics Regulation (OSR) has undertaken a short review of the reporting of these data. While it is for producers to set out their methods and explain the data, we have included some tables and charts to help explain.
We have identified several recommendations for the Office for National Statistics who produce the National Statistics ‘Deaths registered weekly in England and Wales’.
Measuring excess deaths
As with many topics, different measures can be produced by different government departments and organisations – and this is the case for excess deaths reporting.
Weekly excess death measures
For England and Wales there are at least three main sources of data on weekly excess mortality – Deaths registered weekly in England and Wales produced by ONS, Excess mortality in England produced by the Office for Health Improvement and Disparities (OHID) and Mortality monitor (England and Wales) produced by Continuous Mortality Investigation (CMI). Other weekly mortality data are produced – such as Weekly all-cause mortality surveillance by UKHSA. Each source reports different data on excess deaths depending on how the number of deaths that would have been expected to occur in a particular time period have been calculated.
The approaches taken to calculating expected deaths vary in complexity and draw on different data from previous years to make these excess death calculations. Further details on all the measures mentioned in this paper can be found in Annex A.
We looked at the excess death data from the three sources reported weekly in 2022 – shown in the figures below.
Figure 1: Number of excess deaths in ENGLAND 2022, comparison of sources
| Excess deaths ENGLAND | 2022: Week 1 (ending 7 January) – Week 25 (ending 24 June) | Week 26 (ending 1 July) – Week 52 (ending 30 December) |
|---|---|---|
| ONS | 2,985 | 29,961 |
| OHID | 894 | 29,478 |
Sources: ONS – Deaths registered weekly in England and Wales dataset (2022 edition), OHID – Excess mortality in England data download (published January 2023)
Figure 2: Number of excess deaths in ENGLAND and WALES 2022, comparison of sources
| Excess deaths ENGLAND and WALES | 2022: Week 1 (ending 7 January) – Week 25 (ending 24 June) | Week 26 (ending 1 July) – Week 52 (ending 30 December) |
|---|---|---|
| ONS | 3,071 | |
| CMI | 3,280 | 24,123 |
Sources: ONS – Deaths registered weekly in England and Wales dataset (2022 edition), CMI – Mortality monitor weekly reports
Figure 3: Cumulative Excess deaths for ENGLAND 2022: comparison of sources
Sources: Deaths registered weekly in England and Wales dataset (2022 edition), OHID – Excess mortality in England data download (published January 2023)
Figure 4: Cumulative Excess deaths for ENGLAND and WALES 2022: comparison of sources
Sources: Deaths registered weekly in England and Wales dataset (2022 edition), CMI – Mortality monitor weekly reports
We found that
- There is notable difference in the pattern of excess deaths reported by CMI and ONS at the beginning of 2022. This may be in part due to inclusion of 2021 data in ONS’s five year average, which had a high number of COVID-19 deaths in early part of that year.
- The same difference in trend is not present when comparing ONS data with OHID. That may be due to the inclusion of 2015 data in the OHID modelling given the high flu mortality in that year.
- While there are differences in the data across the sources, all three do reflect the trend of a marked increase in excess death in the latter part of 2022.
ONS monthly excess mortality measures
ONS itself produces different measures of excess mortality. On a monthly basis, ONS publishes its Monthly mortality analysis, England and Wales. In this output, excess mortality figures are provided in the form of both excess deaths (the difference between the observed deaths within a period compared with the five-year average) and excess mortality by the age-standardised mortality rates (ASMRs) (the difference between the observed ASMRs within a period compared with the five-year average ASMRs).
Calculating excess mortality using the ASMRs method allows for differences in the age structure of populations and therefore allows comparisons to be made between geographic areas, over time and between sexes. It should be noted that as mortality rates take into account the population size and age structure at a given period, it is not unusual for excess mortality rates to be lower than excess deaths and ONS provide information on the calculation of ASMRs in its User guide to mortality statistics.
In the December publication of its Monthly mortality analysis, ONS clearly set out the differences between the excess deaths and ASMR measures for the period January to December 2022, see the chart produced by ONS below. ONS reports that when looking at the excess mortality in 2022 overall, deaths were 6.3% above average, whereas ASMRs were 0.7% below average.
Figure 3: In England, deaths in 2022 are above average, but when accounting for population size and age structure, mortality rates are below average
Percentage of excess mortality, compared with the 2016 to 2019 and 2021 five-year average, by number of deaths and age-standardised mortality rates, England, deaths registered in January to December 2022
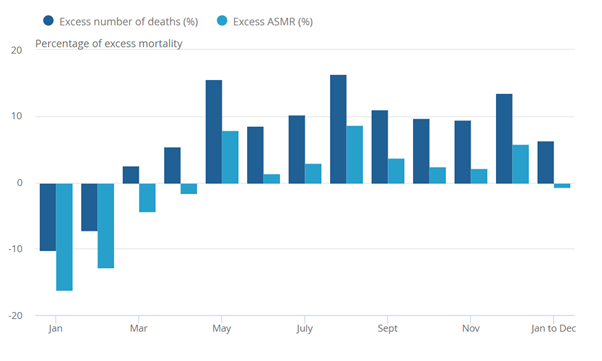
Source: Office for National Statistics – Monthly mortality analysis
While ONS has drawn attention to the differences, it has fallen short of providing users with support in interpreting these inconsistent measures of mortality for 2022 overall.
Summary
It is not unusual for different measurements to be produced and made available to inform public debate and planning. Having multiple measures can be useful and constructive – for example, different measures may serve different purposes or meet different user needs. However ONS should provide its data users with suitable information to help them understand and interpret the landscape. We do not consider this is currently the case with ONS’s statistics on excess mortality. For example, while ONS clearly communicated which years were included in its five-year average calculation, we found little or no reference to supporting information on excess deaths in ONS’s weekly output. ONS needs to explain what its rationale is for its methods, what it’s trying to achieve, and how what it does compares with other sources.
Back to topONS’s approach to improvements and collaboration
Looking across ONS’s range of reporting on registered deaths in recent years, it is clear that the team working on these statistics is dedicated to meeting the public’s needs for new and timely data on mortality. For example, where ONS has published data on particular topics of interest such as Excess mortality during heat-periods in a joint analytical article between ONS and UKHSA.
We also consider the ONS team has strong links with partner organisation and works collaboratively in developing and producing its statistics. For example ONS jointly produced an article on Comparing different international measures of excess mortality with Government Office for Science (GOScience).
The ONS team does face the challenges of developing its current statistical provision and addressing newly emerging users’ needs – often to tight timescales – alongside keeping up with its regular outputs.
Back to topReporting excess deaths in the future
ONS has started to produce its weekly registered deaths and excess death data for 2023 using a similar method as it has done in previous years. As with the average used for comparison with 2022 data, registered deaths from 2020 have been excluded (The average for 2015 to 2019 is used for comparisons with 2020 and 2021. The average for 2016, 2017, 2018, 2019 and 2021 is used for comparisons with 2022. The average for 2017, 2018, 2019, 2021 and 2022 is used for comparisons with 2023). Given the importance of these data and the implication of retaining existing methodology given shocks to the system in recent years, we consider ONS must review its methods and approach to ensure its statistics are fit for purpose.
ONS announced on Friday 10 February that it has established a technical working group, with representation from across producers of these data and other government departments, and the devolved nations to take this forward. This is a positive step in seeking to innovate and improve its statistics. We understand that ONS, in conjunction with its partners, is exploring more modelled based approaches, including nowcasting, in order to assess whether a more sophisticated, longer term modelling approach would improve its estimation.
We have asked ONS to:
- Be open and proactively engage with a wide range of users about the development work it is undertaking and its decision making throughout this process.
- Improve how its data are presented and how any uncertainty in the data is explained to users. While there isn’t one definitive right answer on what the expected number of deaths should be, users should be supported in understanding this.
- Review its understand of users’ needs, as different users may have different uses of these data and therefore different methodologies may be suitable in different circumstances. This means reviewing, considering and explaining what it means by ‘expected deaths’ when calculating excess mortality.
We recognise this work will take some time to complete and we encourage OHID, CMI and other members of the technical group to work with ONS to provide clarity and a better understanding of coherence of mortality statistics for users. To support users now,
We have asked ONS, at the earliest opportunity, to provide its users with clear, accessible information on:
- its methods and the reasons why it has chosen to apply those methods
- the differences in approach taken to measuring excess mortality including signposting to the different sources of data
- how to interpret differences in the resultant published data
As this is such an important topic, we have asked ONS to ensure sufficient support and resource is allocated to take forward the review of excess death methods alongside its other planned work for the coming year.
Back to topAnnex
| Organisation | Publication title | What is reported | Published information on methodology |
|---|---|---|---|
| ONS | Deaths registered weekly in England and Wales | Weekly excess deaths for England and Wales |
Information published in weekly bulletin:
|
| ONS | Monthly mortality analysis, England and Wales | Monthly excess mortality and age standardised mortality ratios (ASMRs) for England and Wales |
Information published in monthly bulletin and user guide: Age-standardised mortality rates (ASMRs) allow for differences in the age structure of populations. This allows comparisons to be made between geographic areas, over time and between sexes. |
| Office for Health Improvement and Disparities (OHID) | Excess mortality in England | Weekly excess deaths for England (produced monthly) |
Information published in methodology report:
|
| Continuous Mortality Investigation (CMI) | Mortality monitor (England and Wales) | Weekly excess deaths for England and Wales |
Information published in weekly releases and 2019 working paper:
|
See the annex in our downloadable PDF of the report
Back to top