Analysis of concerns about the statistics
This section sets out the analytical concerns about the statistics.
As we set out in our interim report, measuring gender identity is undoubtedly challenging. Gender identity is inherently personal and therefore can be a sensitive topic. Those whose gender identity differs from their sex represent a small proportion of the population. The concept of gender identity may be unfamiliar to some, others may not feel they have a gender identity, and there are few robust alternative sources of data to cross-check against. These factors create challenges to developing new statistics.
Following the first release of the census statistics on gender identity in England and Wales in January 2023, concerns were raised publicly with ONS and with us about the published estimates of the trans population. As additional census data were published, these concerns extended to the relationship between gender identity and proficiency in English. We also received concerns about the level of methodological information published.
We noted in our interim report that those aged 16 and over whose main language is not English (or Welsh if using the Welsh questionnaire) made up 10 per cent of the overall population in the ONS census data, but 29 per cent of those whose gender identity differed from their sex registered at birth. Additionally, the geographical areas with the highest proportion of people reporting themselves as trans in the census were areas that also had a high proportion of people whose first language is not English (or Welsh). Further, we shared that these data led some users of the census gender identity statistics to conclude that the question on gender identity may not have been understood by some, particularly those with lower English language proficiency.
Michael Biggs, Associate Professor in Sociology at the University of Oxford, explored some of these concerns in a Spectator article and an April 2023 research paper, Gender Identity in the 2021 Census of England and Wales: What Went Wrong?. These publications were cited by several stakeholders we spoke to as important pieces of work in informing their views on the quality of the data.
Some stakeholders we spoke to, who also contributed to our interim report, told us that their initial concerns that the question may have been more likely to be misunderstood by those with lower English language proficiency had been justified by the findings set out in the ONS research report, Quality of Census 2021 gender identity data, published in November 2023 and by the information in the additional data tables.
The publication on 27 June 2023 of Scotland’s Census 2022 statistics on sexual orientation and trans status or history has provided additional data. The publication of these statistics further supports the view that the question in the England and Wales Census was misunderstood by some respondents, and that this had an impact on the quality of the gender identity data collected in the England and Wales Census.
This section of the report looks at to what extent the publication of the ONS research report in November 2023 addressed these concerns. Additionally, we consider whether its publication has mitigated any remaining concerns, such as by providing increased quality information on uncertainty or additional guidance on using the statistics.
English language and “none specified” gender responses
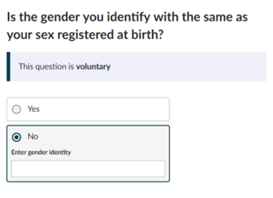
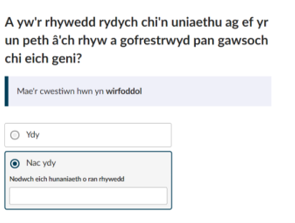
Census respondents who recorded “No” to the question “Is the gender you identify with the same as your sex registered at birth?” in the ONS England and Wales Census were prompted to write in their gender identity. This write-in box could be left blank (Figure 3).
Of the 262,112 adults recorded as having a gender identity different from their sex registered at birth, 117,775 people were classified in the census category ‘Gender identity: different from sex registered at birth, but no specific identity given’; they left the box blank; or, if they did write in a response, it was not coded as valid. This figure equates to 0.24% of respondents (Table 1).
| Gender identity the same as sex at birth | % | Gender identity different from sex registered at birth, but no specific identity given | % | Gender identity different from sex registered at birth and specific identity given | % | Not answered | % | |
|---|---|---|---|---|---|---|---|---|
| All usual residents aged 16 or over | 45,389,635 | 93.46% | 117,775 | 0.24% | 144,335 | 0.3% | 2,914,625 | 6.00% |
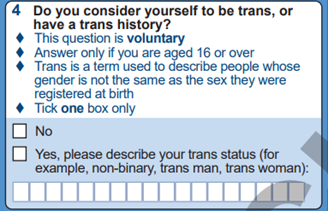
In Scotland’s Census, respondents who ticked “Yes” to the question “Do you consider yourself to be trans, or have a trans history?” were asked to describe their trans status. Examples of non-binary, trans man and trans woman were also given. This write-in box could be left blank (Figure 4).
The NRS Scotland Census data show that 19,987 people answered “Yes” to whether they consider themselves to be trans or have a trans history. 0.07% of census respondents aged 16 and over did not provide a specific gender identity or trans status (Table 2). They left the box blank, or, if they did write in a response, it was not coded as valid. These responses are recorded in the census category “Yes: Trans status or history not otherwise specified”. Editors note: This paragraph was edited post publication to improve clarity – see more details here.
| No: Not trans and does not have a trans history | % | Yes: Trans status or history not otherwise specified | % | Yes: Trans or has a trans history (specified) | % | Not answered | % | |
|---|---|---|---|---|---|---|---|---|
| All people aged 16 and over | 4,259,372 | 93.64% | 3111 | 0.07% | 16,876 | 0.37% | 269,230 | 5.92% |
The ONS and NRS data are set out comparatively in the Scotland quality assurance document (Figure 5).
While the quality assurance report for the Scotland Census expresses that caution should be used when interpreting the difference between Scotland Census trans data and the England and Wales Census gender identity question due to the different questions being asked, the Scotland data show that a greater percentage of census respondents ‘wrote in a response’ in Scotland than in England and Wales. The different focus and wording of the question used in Scotland may have been better understood than the focus and wording in England.
The ONS research report, which was published prior to the publication of the Scotland Census data, investigated patterns of trans identification by proficiency in English. The report noted that:
“of those who indicated their gender identity was the same as their sex registered at birth, around 2% did not speak English well. This proportion was around 13% for those who indicated their gender identity was different to their sex registered at birth and did not write-in a specific gender identity. These patterns were still evident after adjusting for the different age profiles of the groups involve.”
Further, ONS noted that:
“respondents recorded as trans who were born outside the UK or had a lower proficiency in English were around twice as likely to tick the box and not write in a response compared with other trans respondents” (Table 3) and that “This could be attributed to either the tick-box being answered inaccurately, or those with lower proficiency in English not being sure how to accurately describe their identity in English, or simply wanting to minimise the amount they needed to write in their response to this voluntary question.”
| Population group | Gender identity the same as sex at birth | % | Gender identity different from sex registered at birth, but no specific identity given | % | Gender identity different from sex registered at birth and specific identity given | % | Not answered | % |
|---|---|---|---|---|---|---|---|---|
| All usual residents aged 16 or over | 45,389,635 | 93.46% | 117,775 | 0.24% | 144,335 | 0.30% | 2,914,625 | 6.00% |
| Main language is English (English or Welsh in Wales) | 41,296,005 | 94.05% | 69,165 | 0.16% | 116,625 | 0.27% | 2,428,405 | 5.53% |
| Main language is not English (English or Welsh in Wales) | 4,093,630 | 87.92% | 48,610 | 1.04% | 27,720 | 0.60% | 486,220 | 10.44% |
| Of which, can speak English | ||||||||
| Very well | 1,786,555 | 90.65% | 9,930 | 0.50% | 9,665 | 0.49% | 164,670 | 8.36% |
| Well | 1,480,955 | 86.20% | 23,295 | 1.36% | 11,720 | 0.68% | 202,060 | 11.76% |
| Not well | 703,400 | 85.44% | 13,135 | 1.60% | 5,515 | 0.67% | 101,230 | 12.30% |
| Not at all | 122,725 | 85.20% | 2,245 | 1.56% | 805 | 0.56% | 18,255 | 12.67% |
A breakdown of census data by English language proficiency is presented in the quality assurance report for the Scotland Census. The pattern of data observed in the ONS census data – that respondents with a lower proficiency in English were more likely to state their gender identity was different to their sex and birth but not to write in a gender identity – was not apparent in the trans and trans history data from the Scotland Census (Table 4).
| No: Not trans and does not have a trans history | % | Yes: Trans or has a trans history - all | % | Yes: Trans status or history (not otherwise specified) | % | Yes: Trans or has a trans history (specified) | % | |
|---|---|---|---|---|---|---|---|---|
| Main language is English | 4,016,453 | 93.65% | 18,396 | 0.43% | 2858 | 0.07% | 15,538 | 0.36% |
| Main language is not English - speaks English very well/well | 197,700 | 93.68% | 1,365 | 0.65% | 177 | 0.08% | 1188 | 0.56% |
| Main language is not English - speaks English not well/not at all | 45,219 | 92.46% | 232 | 0.47% | 82 | 0.17% | 150 | 0.31% |
National vs local level estimates
ONS has found in its research that it cannot say with certainty whether the census estimate that 0.54% of the population who identify as a gender that is different to their sex registered at birth is more likely to be an overestimate or an underestimate. The report also states that, from ONS’s research comparing the census estimates with other available sources, it found no reason to conclude that the census statistics on gender identity were implausible.
The research report recognises that while the GP Patient Survey (GPPS) is a good comparator for the census data, in that it has very good coverage of the population and collected data for a similar point in time, it has a drawback as a comparator in that the wording of the question is very similar to that on the census. The report acknowledges there could be a risk that any respondent errors are correlated across the two sources.
The research report compared the census estimates of the trans population with the 2021 Canadian Census and surveys in the United States. The Canadian 2021 Census results show that 0.33% of Canada’s population provided an answer to the gender question that was different to their answer to the sex question. The report shares that studies in the United States suggest that between 0.3% and 0.6% of the country’s population identify as a gender that is different to their sex registered at birth.
The publication of Scotland’s Census data on trans status or history, which followed the ONS research report, has contributed to a better understanding of the trans population. Scotland’s Census 2022 found that 19,990 people were trans or had a trans history. This figure equates to 0.44% of people aged 16 and over (Table 5).
| Category | Scotland 2022 | England and Wales 2021 |
|---|---|---|
| Trans people* | 0.44% | 0.54% |
| Not stated | 5.92% | 6.00% |
Table 5. Percentage of trans people, Scotland 2022 and England and Wales 2021. Source: NRS quality assurance report
*Trans people: defined in the Scotland quality assurance report as people with a trans status or history in Scotland and people with a gender identity different from their sex registered at birth in England and Wales.
While the proportion of trans people identified in England and Wales is 0.1 percentage points or around 23% higher than in Scotland, data from both ‘England and Wales’ and ‘Scotland’ are broadly comparable, indicating a trans population of around “1 in 200”.
Communicating uncertainty in the data
Clearly communicating any uncertainty around estimates is an important part of ensuring the appropriate use and interpretation of statistics, as it helps users of the data understand the data’s strengths and limitations.
Our interim report found that ONS should have communicated the inherent uncertainties in this new data collection when it published the data to aid use, stating that “There remains an absence of an overarching message that explains the nature of this uncertainty and that clearly sets out that ONS is still trying to understand the data through further analysis. There appears to be some reluctance from ONS to communicate uncertainty unless it can be quantified.”
We commented that had ONS done so, it would have aided users’ understanding of the appropriate use of the data and provided relevant context when issues were identified by users. Further, we advised ONS to communicate in its future research how the gender identity data can and cannot be used.
We have looked again, using the principles set out in our guidance on communicating uncertainty, at how ONS has communicated uncertainty. We reviewed ONS’s research report, Quality of Census 2021 gender identity data, and the presentation of uncertainty in the gender identity data across a number of census outputs.
ONS’s research report provides valuable information for users on the potential sources of uncertainty in the gender identity estimates. To date, the report is the most comprehensive overview of uncertainty ONS has provided for these data. It explores a wide range of possible factors, many of which had not been previously presented in the statistical bulletin or the quality information. The research report also provides ONS’s conclusions on whether each factor has likely impacted the quality of the data. The dataset included in the research report provides data tables to allow users to explore the variation in distribution across local authorities and individual and household characteristics.
The report states that there are good reasons to expect higher levels of uncertainty with the estimates relating to the gender identity question than for other census topics. It also shares that users of the data told ONS that they expect higher uncertainty around census estimates for this topic, particularly as it is a voluntary question, and that they would welcome more information to support their use of the data. To meet this need, ONS released additional tables alongside the report and an accompanying explanation of how these data should be used. The explanation includes the following information and advice:
Proportion of write-in responses for local authorities
This data table gives the proportions of the estimated trans population within each local authority who provided a write-in response (census respondents who recorded “No” to the question “Is the gender you identify with the same as your sex registered at birth?” and also wrote in a gender identity).
With regards to the use of these data, ONS advised that:
“If gender identity estimates for a particular local authority are based on a low proportion of write-in responses (therefore a higher proportion of tick-box only responses), then users may wish to exercise greater caution in using these statistics and consider them alongside other data sources and local knowledge for practical purposes.”
Topic distributions by gender identity
These tables provide alternative presentations of previously published data on individual characteristics by gender identity, household characteristics by gender identity, sex by proficiency in English by gender identity and gender identity by country of birth.
ONS advises that:
“For each topic, they show the distribution across categories for the estimated trans population and additionally the distribution based only on those who provided a write-in response to the question. Topics where both distributions are similar are likely to be relatively unaffected by any respondent error resulting from simply ticking the wrong box. A greater degree of care would be advisable where the distributions are markedly different.”
Where uncertainties are highlighted, it is not fully explained how they affect the use of the data. We are concerned as to how easy it would be for a member of the public or a casual user to easily understand any limitations with the gender identity data. While ONS states in its research report that the users it spoke to “understand the relatively high levels of uncertainty in the estimates for this topic”, we consider they are likely to be expert users, and that ONS should do more to support a wider range of users of the data.
Understanding uncertainty is also complicated by the number of separate ONS publications on this topic and the different levels of detail provided in each. For example, the quality report Sexual orientation and gender identity quality information for Census 2021 does not convey the same level of information as the research report.
Many users will likely have complete confidence in the data solely by virtue of them being published by ONS and may not seek to conduct their own detailed analysis of their strengths and limitations or seek out this information in the first place.
We consider the following points:
- Providing updates to the interpretation of these estimates should be regarded as a normal part of ongoing statistical production for a new area of data collection by ONS. The same would be true of any changes to the initial estimates, as long as they are fully and transparently explained. Such updates should not undermine user confidence in the robustness of the census results as a whole, as most questions in the census have been asked many times before.
- While the ONS research report provides additional information and explores potential sources and impacts of misestimation, ONS’s headline message around the validity of the census data, and how users should interpret and use the data at national and smaller area levels, is unclear.
- There is insufficient evidence for any implication that these uncertainties support the central estimate as the best estimate.
- Most users of the data would reasonably expect some estimate of underestimation of the trans population from non-response from data on a sensitive topic – recognising the voluntary nature of the question – but would not reasonably expect the correlations that imply sub-groups misunderstood the question.
- Statisticians are used to dealing with the usual uncertainties that come with sensitive topic survey data, and many regular and expert users are familiar with these as well. However, in this case the potential misunderstanding of the question adds an additional uncertainty that users would not reasonably expect. This scenario is distinctive and uncommon, and the uncertainty information should indicate this.
- Trans identity represents a comparatively small proportion of the overall population. This means the accuracy of estimates is particularly susceptible to over-estimation if the question incorrectly identifies people as trans, as appears to be the case here. This problem of “false positives” should always be considered when collecting data on small populations.
- ONS’s attempts to communicate uncertainty, while welcome, focus on relatively high-level messaging that provides only limited help to users, as it does not fully guide use of the data, particularly at smaller area levels.
- The research report notes that the statistics based on write-in responses may be more reliable than those not based on write-in responses, but there is more advice and guidance that could be given to different types of users to highlight this insight.
- The varying levels of information across the bulletin, quality information and research report have resulted in inconsistent messaging for users regarding the uncertainty of the estimates.
ONS’s position
ONS’s research report Quality of Census 2021 gender identity data published in November 2023 found patterns in the data that are consistent with some respondents not interpreting the question as intended.
In the research report, ONS concludes:
“To summarise our investigation into potential respondent error: there are patterns in the data that are consistent with some respondents not interpreting the question as we had intended. These patterns reflect those respondents with lower proficiency in English and characteristics likely associated with English language proficiency such as ethnicity and country of birth.
However, for the reasons outlined in this report, we cannot say whether the census estimates are likely to be an overestimate or an underestimate of the true value, given other sources of uncertainty, not least the potential impact of question non-response. Therefore, the overall impact on the data of any misinterpretation of the question cannot be determined. To assist users in interpreting the detailed breakdowns of the data, we have produced additional supporting tables.”
Learning from new evidence in Scotland’s Census, the Office for National Statistics (ONS) wrote to us on 5 September 2024 to request that the gender identity estimates from Census 2021 should no longer be accredited official statistics and should instead be classified as official statistics in development.
In its letter, ONS stated that it:
“cannot quantify all the uncertainty surrounding responses to the Census 2021 question on gender identity, however the available evidence does show there is potential for bias in how the question was answered by those who responded that they did not speak English well. Changing the designation of the statistics helps to signal the limitations arising from this issue, while also better signalling the fact that our knowledge and understanding of the best approach to collecting data on gender identity continues to evolve.”
We welcome statistics producers approaching us when they have any concerns about the statistics they produce.
Back to top