Findings
Data quality
1.1 ONS has seen a longer-term pattern of falling response rates for the Wealth and Assets Survey (WAS), as shown in Chart 1. The overall response rate for the latest round, round 8 (2020–22), was 41% – a seventeen–percentage–point reduction from round 7 (2018–20) and a notable drop compared to a peak of 66% in round 4 (2012–14).
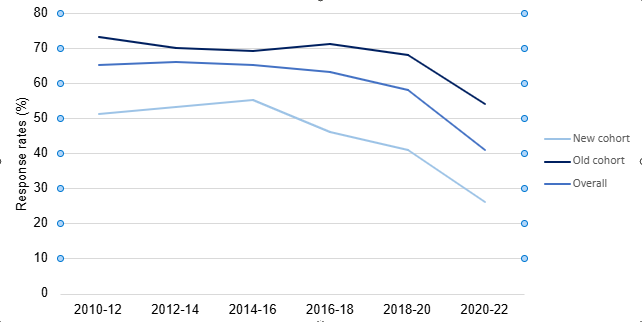
Source: Wealth and Assets Survey QMI – Table 2 (Chapter 5).
1.2 The COVID-19 pandemic adversely affected the response rates, achieved sample sizes and representativeness of household social surveys, including the WAS. ONS used standard statistical techniques to help mitigate biases of the achieved sample, including editing, imputation and weighting processes, as outlined in the quality and methodology information (QMI). Response rate challenges have been a feature of other household survey collections, particularly in collections with a longitudinal element. The social research community is keen to understand the root causes of declining response rates and what can be done to improve them. Wider research into improving the performance of household surveys is underway, coordinated by the Economic and Social Research Council. We are glad that ONS is feeding into this research.
1.3 Round 8 data were collected during the COVID-19 pandemic and the associated restrictions. ONS took steps to ensure it could continue to collect data, including:
- a change in mode from face-to-face interviewing to telephone interviewing, which included using a shortened survey
- a limited ‘knock-to-nudge’ intervention was implemented, with interviewers calling to encourage participation
- a temporary increase to incentives
However, adding to the difficulties in interpreting the estimates, this period also led to changes in household behaviour in managing wealth as households adapted to restrictions and the impact of the various government support schemes. ONS published an analysis of the impact of the pandemic on social survey data collection.
1.4 ONS investigated a range of variables and introduced new weighting across all its social surveys to better address an over-representation of owner-occupiers during the COVID-19 pandemic. For the WAS, an extra weighting was applied for tenure to reflect the oversampling of owner-occupiers and under-sampling of renters observed during round 8.
1.5 To accompany the latest WAS release (round 8), ONS published confidence intervals for some key metrics, but this was done for the first time for this round, so we cannot make comparisons on these over time. While confidence intervals haven’t been made available until recently, quality information is available in the form of standard errors and coefficients of variation going back to the start of the WAS.
Back to topUser perspectives on data quality
1.6 We engaged with nine organisations as part of our review (listed in Annex A). Many users we spoke to noted appreciation for the survey and the unique role of the WAS, as there are no other free, publicly available datasets providing a comprehensive view of household wealth. However, the overall sentiment from users was that the statistics based on the WAS no longer meet their needs.
1.7 Users recognised that the pandemic was a challenging period for data collection and ONS took steps to ensure that data collection could take place during public health restrictions. Key to understanding data quality is determining the extent to which ONS was able to mitigate the impact of the pandemic on quality in a way that ensured user needs could still be met.
1.8 Our discussions with users identified two main issues that concerned them – precision and confidence in weighting and imputation.
1.9 Precision: Many of the users we spoke to felt that the data no longer met their needs because, as the sample size had dropped, the precision of estimates, particularly at the more-granular data had decreased. Users felt that they would need to make a lot more assumptions and include caveats about the quality of their own analyses because the data were showing less precision. In some cases, users noted that the data were not good enough for them to use. For example, one user noted that in round 7, changes had been made to the Business Wealth questions, making them less usable, and so they had to rely on uprating the data from round 6. Another user noted that the small sample size limits what can be done with the data.
1.10 Confidence in weighting and imputation: Users were not assured that the imputation and weighting were adequately compensating for the decreased precision of the data resulting from reduced response. Despite the introduction of tenure weighting, the bulletin notes that caution should be applied when comparing London to other regions, and some tables relating to regional property wealth were removed owing to concerns over the robustness of their estimates. ONS told us they believe the weighting is performing as expected and lower median property wealth in London is likely a true reflection of a much higher proportion of renters and the unique nature of wealth in this region. There remains high volatility in the results for London, likely driven by the small sample sizes and non-response bias.
Back to topTimeliness
1.11 For the WAS, there is usually a lag of two years between the end of data collection and the publication of results. The output that ONS published in January 2025, based on round 8 data collected from 2020 to 2022, was initially expected in November 2023. ONS told us that the extra delay was due to the need for extended quality assurance coupled with resource limitations across the statistics team. All users we spoke to felt that the delay to the publication for this latest round meant that any analysis they performed would be less relevant.
1.12 To speed up the processing and reduce the time to publication, ONS is working on an automation pipeline. ONS told us that it is part way through an exercise for the WAS to uplift the existing editing and validation stages; prepare data for statistical imputation; calculate derived analysis variables; and create microdata from legacy SPSS systems to an R-based pipeline that is simpler to maintain and run. However, due to resource constraints, this work will not be fully complete until round 10.
Back to topCoherence
1.13 Given the current challenges with statistics about household wealth, WAS users are looking at a wider range of indicators to triangulate their estimates and draw conclusions on the resilience of households. One user we spoke to expressed concern that the latest data do not seem coherent with data from other sources, such as the Annual Survey of Hours and Earnings and the census. It is important that users have sufficient information, support and guidance on the performance, strengths and limitations of the various relevant data sources to support their work.
1.14 The quality and methodology information for the WAS mentions that ONS compares its data sources against others, but does not clearly set out which ones are used. ONS told us that, whilst not directly comparable, it uses data from the Living Costs and Food Survey, data from the Family Resources Survey, and administrative data such as Driver and Vehicle Licensing Agency records and reported house price indexes from Nationwide, Halifax and the Land Registry.
1.15 The approach adopted to valuing pensions wealth in the WAS differs from that taken in the National Accounts balance sheet. This difference is mentioned in the bulletin, where it says that the approaches are ‘not directly comparable because of differences in the concepts, data sources, and methods, reflecting the different purposes for which the two sources are designed.’ In the interests of transparency, ONS has agreed to include in the bulletin more information on the nature of the differences and how they relate to the differing purposes of the sources.
1.16 In its paused transformation programme for the household financial surveys, ONS did set out that it wanted to use more administrative data, as part of developing a cross-cutting dataset on income, wealth and expenditure. During a public consultation, users highlighted some wider potential uses, but also raised concerns around the use of administrative data, such as barriers to access and definitional challenges. ONS has indicated that it plans to consider the wider body of thought on using administrative data for wealth measurement, should it be able to resource this work in future.
Methods changes for pensions wealth
1.17 One of the key uses of the WAS is to measure changes in household wealth over time.
1.18 In 2023, ONS asked the Government Actuary’s Department (GAD) to support its review of the methodology used to value pensions wealth. An element of the method chosen to value defined benefit (DB) pensions was the use of the Superannuation Contributions Adjusted for Past Experience (SCAPE) discount rate. This method change involved changing the way ONS calculated variables in the microdata covering total wealth, total pensions wealth, current occupational defined benefit pensions wealth, retained DB pensions wealth, spousal and widower pensions and pensions in payment wealth.
1.19 By utilising an independent and expert view on the methodology from GAD, ONS followed best practice. ONS accepted the recommendations from GAD’s review. When commissioning the GAD to review its methodology, ONS’s primary objective for the model was that it should produce outputs which reflect a true, un-biased value of DB pensions wealth. ONS also asked the GAD to take the following factors into account: stability, consistency, practicality, durability and continuity. The relative prioritisation of stability reflected the views of the project technical group of funders and core users, which included the Department for Work and Pensions, HM Revenue & Customs and the Scottish Government.
1.20 ONS told us that it engaged with core users throughout the course of the review by hosting workshops and directly discussing the varying viewpoints, ahead of publishing the outcome. Due to its technical nature, however, some users opted not to input into the process. Users we spoke to felt that the engagement with ONS during the review nevertheless could have been better. ONS has set out the next steps on pensions in the ONS summary of the DB changes, but some users felt that ONS should have communicated the changes more clearly, given the nuance and complexity around measuring concepts such as future pension wealth. Overall, users did not feel fully informed about changes to the survey design and its impact on how the data should be used.
1.21 Methodology changes that have the potential to lead to breaks in time series are sometimes required, and statistical producers need to make decisions about what is appropriate to allow users to calculate a trend. Producers need to engage with users to understand whether a back series could or should be calculated and, if not, how best to balance any trade-offs for users if improving methods necessitates breaking consistency in a time series.
1.22When making the change to the DB pensions wealth, ONS noted that there were no current plans to revise the back series. Instead, a discontinuity in time series data was annotated on charts and data tables from round 8 onwards. To help user interpretation, the impact of this updated method on previously published pensions and total wealth figures was presented in Tables 1 to 7 of the summary of the DB changes. However, some users were disappointed that ONS’s limited resources meant it chose not to provide a back series of microdata, which has impacted on the usefulness of the data.
1.23 There are strong and varying views, including among users, of the optimal way of calculating pensions wealth. ONS should keep its approach under review to ensure that it continues to best serve user needs. ONS has told us it intends to continue to engage with the GAD for regular actuarial support, and it plans to publish annuities for the next rounds of the survey. ONS has made microdata available through the UK Data Archive, and the data will also be available through the ONS Secure Research Service. This approach to releasing data will allow expert users to apply their preferred approach to DB pension wealth calculations.
1.24 ONS also made some changes which meant that users could not compare previous data rounds. For example, a change to some of the survey questions on business wealth between round 7 and round 8 has made the data less useful for some users.
Engagement with users
1.25 We spoke to a range of users, some of whom are members of ONS’s Wealth and Assets Survey core and some of whom are not. The users we spoke to have been disappointed with the frequency and timeliness of engagement they have had with ONS about the WAS, through both informal and formal channels. We heard that the frequency of meetings for user groups had been reduced, and ONS told us this was due to the pausing of the household financial survey transformation programme. Some users also noted that engagement seemed to have become less effective since the COVID-19 pandemic.
1.26 Some users were unclear about the governance structure within ONS and what stakeholder groups now exist to feed into developments with the WAS. ONS told us that there used to be a mechanism for wider stakeholders to feed into developments of the WAS questionnaire. This process was carried out for round 8 but was disrupted by the pandemic and has not been reinstated because of resource constraints. ONS also told us that formal user groups currently meeting include the Household Finance Statistics User Group and the Income and Wealth User Group. ONS is also in the process of re-establishing a regular WAS expert group to listen to and inform users in future. Users would like the technical groups to meet more frequently and to see user groups not just for key government funders, but also expert users and academic researchers.
1.27 As noted earlier, the latest WAS output was delayed by over 12 months. ONS told us that it informed members of the WAS core user group, and other key users, about the delay as soon as possible. Users were frustrated by the delay, and, whilst ONS publicised the delay and updated users who were on its mailing lists, some users told us that they were not told about the reasons for the delay. Whilst provisional information was provided on ONS’s website six weeks ahead of time, users mentioned that the release date for the output was only announced one week before publication, which meant that some users missed it entirely.
Communicating data quality issues to users
1.28 ONS’s latest publication on household total wealth in Great Britain covers the pandemic period. This circumstance has added additional uncertainty and complexity in interpreting the data, because managing the pandemic caused multiple impacts on the survey design. In the bulletin, ONS has identified that the situation caused by the pandemic has impacted the data, but it has not been able to explore the effects of all the changes to the survey instrument on the estimates, as it lacks a control group.
1.29. The impact of declining response is not fully addressed in the quality and methodology information (QMI) for the WAS, or elsewhere. There are references to the data collection for round 8 being difficult, especially owing to COVID-19, and ONS published an analysis report titled Impact of COVID-19 on ONS social survey data collection in 2022. But these discuss the under-sampling and over-sampling of different subgroups more than response rate or achieved sample issues. As mentioned in the bulletin and QMI, ONS does say a small number of tables have been removed on quality grounds, but the reasons could have been explained more transparently and explicitly. It is difficult for users to piece together the reasons for bias, and there are inconsistent messages between sections of the QMI itself. ONS could say more about the impact of the declining response rate in the QMI, and users would welcome this. While the QMI is linked within the bulletin, some users told us that they were unable to locate it. ONS should review the material in the QMI, update it to reflect all data concerns more transparently and improve the signposting between documents.
1.30 ONS publishes standard errors and confidence intervals for the headline aggregate and median estimates. Since the quantified measures of uncertainty are only published at a high level, they are not quoted regularly in the publication. Where there is greater uncertainty, the lack of a quantified uncertainty estimate has been indicated by “treat with caution” warnings on the bulletin. These warnings most commonly appear alongside the interregional estimates, but are also given once regarding all the findings in the publication from round 8. To provide users with more information on the quality of the estimates, ONS should publish confidence intervals on more-granular breakdowns.
- reviewing the material in the quality and methods information (QMI) report, updating it to reflect data concerns more transparently and improving the signposting between documents
- publishing confidence intervals on more-granular breakdowns
Resources and the future of the Wealth and Assets Survey
1.31 ONS recognises the issues that have been accruing due to under-investment in the WAS and raised its concerns with us during the review. Limited resourcing has impacted the data production and analytical support to produce this and subsequent rounds of the WAS, and has led to some of the compliance issues highlighted in this report.
1.32 Post-pandemic, ONS was aware that the household financial surveys and statistics needed significant improvement and directly sought user views on the improvements that are most important to them through a formal public consultation. ONS published its response to the consultation in July 2023, outlining a programme of improvement for the household financial surveys. The response noted that ‘More significant change which we had previously planned as part of the project will require further investment’. This programme of work could have represented a strategic response to the longer-running challenges around collecting household financial data and challenges in response rates. However, ONS was unable to resource this programme. Since ONS has paused its improvement work, much of the user feedback given in the consultation remains unaddressed.
1.33 Response rates to the WAS have been adversely impacted by the pandemic, compounding the reduction in response rates from household surveys that is a longer-term trend impacting on the precision of estimates. In 2023, ONS made the decision to prioritise the data collection for the Labour Force Survey and the Living Costs and Food Survey, but this meant it was unable to fully support the WAS, which will impact the next round of data. More-detailed analysis of the funding of data collection over time and the funding constraints faced by ONS can be found in our interim review report of ONS’s economic statistics.
1.34 For round 9 of the WAS (which is based on responses collected from April 2022 to March 2024), ONS has indicated that it has achieved an even lower response rate over the two years. The data are currently being analysed, with a provisional planned date for publication in 2026. ONS told us that the round 9 data are showing the following issues:
- a reduced sample size, impacting both the cross-sectional sample and longitudinal sample
- a risk of questions losing their relevance, and not being fit for purpose, because questions that did not undergo the usual cognitive testing were introduced
- lots of missing responses, so the methodology department is looking at imputation methods beyond the typical donor-matching approach
- delays to processing due to resourcing and competing priorities
- impacts of changing mode from telephone back to face-to-face interviewing
1.35 ONS has told us that it will explore whether its methodology can be updated to offset some of the current quality issues, but it notes that there may still be increased uncertainty around the quality of these statistics.
- The recent delay to the publication of the WAS data was in part due to insufficient resources in the methodology team and the production team to quality-assure and produce the results. Fully resourcing all elements of the WAS, from data collection to processing, analysis and user engagement, is important to address the issues in this report. In our report on ONS’s economic statistics, we have asked ONS to publish a fully resourced plan to recover its social survey operation.