Shining the spotlight on the quality of economic statistics

In our latest blog, Statistics Regulator Emily Carless discusses the importance of quality in economic statistics…

It’s an exciting time to be a regulator of economic statistics in the UK. The economic statistics landscape is changing, with more new and innovative data available than ever before. The challenges presented by increases in the cost of living have also put greater attention on economic data.  The regulatory landscape has also changed: the UK’s departure from the EU means the European statistical office will no longer have a role in verifying the quality of UK statistics. This has created an opportunity for us, as the independent regulator of official statistics in the UK, to develop a new programme to provide continued assurance to users on the quality of economic statistics.

Since March this year I have been leading this programme, which we are calling the ‘Spotlight on Quality: Assuring Confidence in Economic Statistics’.  As part of this programme, we are carrying out a series of quality-focused assessments. To help us do this, we are developing a quality assessment framework. We started with the Quality pillar of our Code of Practice for Statistics, and have adapted it by taking relevant practices from other international frameworks to enable a deeper dive on the many elements of quality in economic statistics.

Earlier this summer we published the report of the first pilot assessment on Producer Price Inflation statistics, which are produced by the Office for National Statistics (ONS). We gathered feedback on the assessment and the programme more generally to get insight into how we can maximise the benefits of the programme. My colleague Job led the first pilot assessment and has this to say:

“ONS’s Producer Price Indices (PPIs) were an excellent candidate for the first quality-focused assessment. The new quality assessment framework that we developed helped us investigate all aspects of quality in greater detail than we normally would in an assessment. We’re continuing to refine the framework to make it an even more effective tool. One thing we trialled with this assessment, which worked particularly well, is speaking to the international statistical community about the UK’s statistics. Conversations with price statistics experts in other National Statistical Institutes gave us an insight into the extent to which ONS is following international best practice in producing PPIs. We’ll look to replicate this approach in other quality-focused assessments.”

We received positive feedback about our quality focused assessments from the experts we spoke to in other NSIs. Espen Kristiansen of Statistics Norway commented on the benefits to the international community of our programme:

“It is very valuable to have an external review of statistics. It reminds us how we can frame a discussion about quality, which for statistics is a surprisingly complex and many-faceted concept. Not only can the review detect flaws, it also makes us better at continuously improving our statistics in the future.”

Users of economic statistics in the UK have also found our quality-focused assessment on the PPIs useful. Cheryl Blake from the Ministry of Defence said:

“We welcome the findings of the OSR report on the quality of the PPIs and the opportunity to provide user feedback, particularly the recommendations to publish weights and standard errors which will greatly help our team better understand the underlying drivers of the indices and their quality. This is of growing importance as there is growing interest across Government in using industry-specific PPIs for indexing contracts to better track prices and provide a fairer return to industry. Further information on sample size and resultant quality will help inform index selection and we hope to work with ONS regarding the rationalising on index publication to ensure the provision of critical indices for indexing Government contracts.”

In carrying out these assessments we aim to be supportive of the producers of economic statistics, to champion where they have improved the quality of their statistics as well as to challenge where further improvement is need. Chris Jenkins, Assistant Deputy Director for Prices division in ONS, highlighted the benefits of these assessments to the producer team:

“The regular churn of our monthly statistics sometimes means we don’t get the opportunity to review the methods and metadata that supports our production process as frequently as we would like. This assessment provided us with the perfect opportunity to take stock of what we do, and the constructive support from OSR highlighted areas where we are doing really well, but also areas where we need to make quality improvements. Having the assessment now gives us a clear set of actions we can take to improve the quality of PPI, which is a key economic indicator.”

The outcomes from our quality-focused assessments also provide useful information on where the quality of other statistics could be improved. We will work with statistics producers and the Statistical Heads of Professions to share good practice and shine a light on where the quality of statistics more broadly can be improved. Rachel Skentelbery, ONS Deputy Head of Profession for Statistics, said:

“We welcome OSR’s new quality-focused assessment programme which complements work we are leading to support ONS colleagues in assessing and improving the quality of statistics. Many of the findings identified in these assessments will be relevant beyond the specific output being reviewed, for example in areas such as RAP [reproducible analytical pipelines], quality assurance, user needs and transparency, and we look forward to working together to share lessons and promote best practice to drive improvements to quality across the organisation.”

Over the next few months we will be publishing the report of our second pilot quality-focused assessment on the Profitability of UK companies and Gross Operating Surplus of private non-financial corporations, and publishing the quality assessment framework that we have developed for use in these assessments.

 

If you are interested in learning more about this programme or have any feedback on our first report then please get in touch by emailing regulation@statistics.gov.uk.

An army of armchair epidemiologists

Statistics Regulator, Emily Carless explores the work done to communicate data on Covid-19 publicly, from inside and outside the official statistics system, supporting an army of armchair epidemiologists. 

In 2020, our director Ed Humpherson blogged about the growing phenomenon of the armchair epidemiologist. Well, during the pandemic I became an armchair epidemiologist too. Or maybe a sofa statistical story seeker as I don’t have an armchair! Even though I lead our Children, Education and Skills domain rather than working on health statistics, I couldn’t help but pay close attention to the statistics and what they could tell me about the pandemic

At the micro-level I was looking at the dashboards on a near daily basis to understand the risks to myself, my family, my friends and my colleagues. I was watching the numbers of cases and hospitalisations avidly and looking at the rates in the local areas of importance to me. I felt anxious when the area where my step-sister lives was one of the first to go the new darkest colour shortly before Christmas 2021, particularly as my dad and step-mum would be visiting there soon afterwards. Earlier in the pandemic, once we were allowed to meet up, my mum and I had used these numbers to inform when we felt comfortable going for a walk together and when we felt it was better to stay away for a while to reduce the risk of transmission. These statistics were informing real world decisions for us.

At a macro-level I was also very interested in the stories the statistics were telling about the pandemic at a population level. The graphs on the dashboards were doing a great job of telling high level stories but I was also drawn to the wealth of additional analysis that was being produced by third parties on twitter. My feed was full of amazing visualisations that were providing additional insight beyond that which the statistical teams in official statistics producer organisations had the resources to produce.

As we highlighted in our recent State of the Statistical System report, the COVID-19 dashboard has remained a source of good practice. The dashboard won our Statistical Excellence in Trustworthiness, Quality and Value Award 2022. The ability for others to easily download the data from the COVID-19 dashboard to produce visualisations and bring further insight has been a key strength. I wanted to write this blog to further highlight the benefits of making data available for this type of re-use. I think Clare Griffith’s (lead for UK COVID-19 dashboard) tweet back in February sums it up perfectly. In response to one of the third-party twitter threads she said ‘Stonking use of dashboard data to add value. Shows what can be done by not trying to do everything ourselves but making open data available to everyone.’ 

Here are a couple of my favourite visualisations (reproduced with permission). 

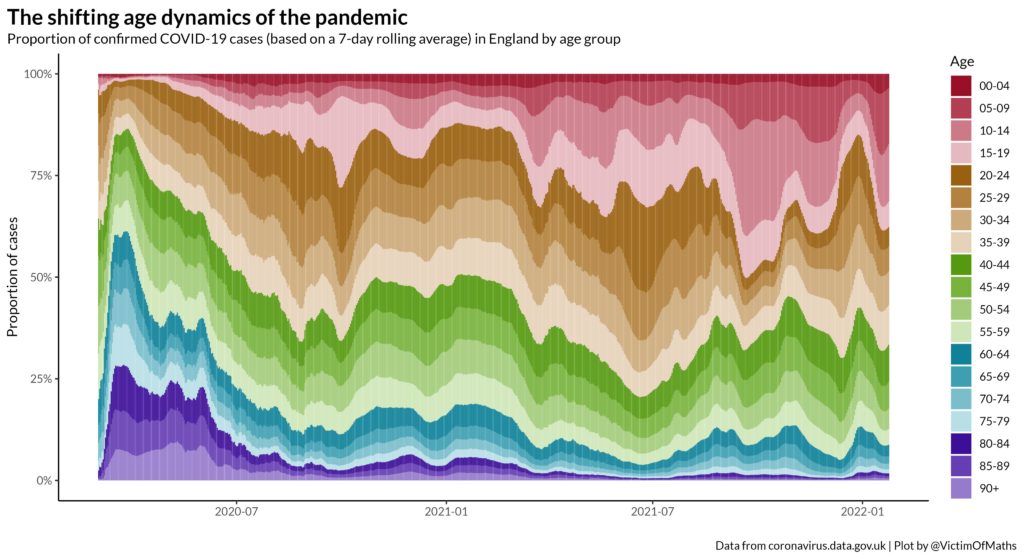
Like Clare, I really like Colin Angus’ (@VictimOfMaths) tapestry by age. It shows the proportion of confirmed Covid-19 cases in England by age group and how that changed during the pandemic. I also liked the way the twitter thread explained the stories within the data and that they made the code available for others. 

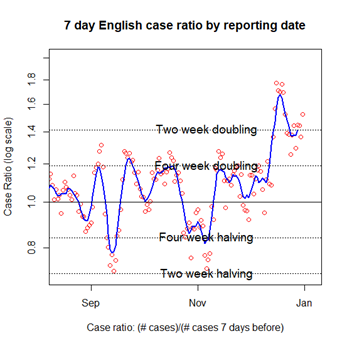
I also liked Oliver Johnson’s (@BristOliver) case ratio (logscale) plots. Although the concept behind them may have been complex, they told you what was happening with cases/ hospitalisations. The plot shows the 7-day English case ratio by reporting date on a log scale using horizontal lines to show where the case ratio showed a two or four week doubling or halving.

There was great work being done to communicate data on Covid-19 publicly from outside the official statistics system, supporting an army of armchair epidemiologists. This demonstrates the changing statistical landscape of increased commentary around official statistics, which we referenced in the latest State of the Statistical System report, at its best. Much of this was made possible by the Covid-19 dashboard team making the data available to download in an open format through an API with good explanations and engaging on social media to form a community around those data. We hope that this approach can be replicated in other topic areas to maximise the use of data for the public good.

The Code pillars: Value – bringing something to the party

Value for me is about why it all matters. Value means that statistics and data are useful, easy to access, remain relevant, and support understanding of important issues. These things mean that the statistics will be used. Without statistics being of value, they risk becoming irrelevant.

Statistics should bring something to the party.

But why should we be invited to the party in the first place?

The pandemic has demonstrated the crucial value of statistics and of statisticians being involved in decision making and debate.

The statistical community really stepped up in providing new, innovative and highly relevant analyses. We sought to provide answers to the questions that decision makers and society needed answered. We saw the power of statistics to inform, to paint a picture. That is what value is all about. We were at the heart of the party! Without us being there, statistics cannot serve the public good. We need to value ourselves, and our statistics to demonstrate that value.

The value of valuable statistics

Early in my career, my colleague and I organised a session about government statistics for a school ‘careers in maths’ day. We were going to spend all day talking to 14-year olds about maths – probably not the most exciting prospect to them.

To try to engage them we developed a session based around why (government) statistics are important. The session, called ‘King for a Day’, involved crowning a child king (or queen) and getting the children to develop the list of statistics that they would need to run the kingdom.

Nothing was out of bounds. If the children decided that knowing the number of goals scored by the top football teams was a priority for their king, then it went on the list. I didn’t realise it at the time, but we had decided to talk about the value of statistics rather than simply how to produce good quality ones.

Without valuable statistics, the children realised their kingdoms couldn’t run properly, and their ‘citizens’ couldn’t hold them to account. They learned the value of valuable statistics, and why they are essential for the public good.

So how do we ensure that we are invited to the party?

We keep getting invited by….

  1. Being relevant – engaging in conversation with others at the party, listening, understanding what they need and responding accordingly.
  2. Being accessible – recognising that different party goers need different things to get the most from the party.
  3. Being clear and insightful – clearly explaining to the others what we are bringing to the party and how it can be useful. Ensuring that what we bring compliments what others are bringing.
  4. Being innovative –keeping listening and improving what we bring.
  5. Being efficient – recognising that we can share resources. Providing a clear rationale for why we are asking for certain things to be supplied to the party, and not overburdening others by asking them to contribute too much.

In short, following the Code of Practice for Statistics, and adhering to its three pillars; Trustworthiness, Quality and Value, ensure that statistics serve the public good.

For more information on the Code and the three pillars, you can visit the Code website. There are also case studies that demonstrate how statistics producers have implemented different practices in the Code.


Think of the children

The Covid-19 pandemic is having a profound impact on all parts of society.  While statistically those medically hardest hit by the disease are the older generations, children and young people are having to come to terms with significant, immediate and possibly long term changes to their lives.

More than ever it is important that statistics about children and young people reflect the lived experiences of children. Statisticians play a key role in ensuring that the data collected and published about children and young people accurately reflects their needs and helps to inform policy and services that work to support them.

Our review

Prior to the pandemic we started reviewing the availability of statistics about children and young people with a view to better understanding their value in society and to determine whether:

  • the current statistics are accessible, timely and help society to understand the experiences of children and young people in all aspects of their lives
  • improvements are needed to the ways in which decisions on what to collect and analyse are reached
  • the wider statistical system is responsive to the needs of users of statistics.

We want to see a step change in how the needs of children and young people are met by official statistics, where statistics producers consistently consider children and young people’s needs and voice during the design, collection, analysis and dissemination of statistics. The current pandemic and its aftermath make this all the more important.

Our initial research has looked at the strengths and weakness of the current statistics on children and young people. In doing so, we have identified three key lenses which, if applied through a structured framework, may support statistic producers to better meet users needs. This approach reflects the core principles set out in the UN Convention on the Rights of the Child.

Our proposed framework

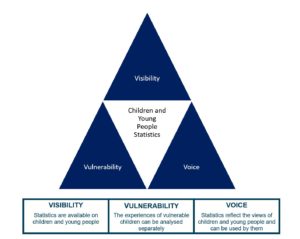
We propose that producers of statistics consider children and young people through three lenses.

  • Visibility – Statistics are available on children and young people
  • Vulnerability – The experiences of vulnerable children can be analysed separately
  • Voice – Statistics reflect the views of children and young people and can be used by them

Children and Young People Statistics. The three lenses: Visibility. Vulnerability. Voice.

For each lens of the framework we propose some key questions for statistics producers to consider.

Visibility – Statistics are available on children and young people

  • Are children and young people visible in the statistics?
  • Is data collected about them and then made available to inform decisions in the best interests of the child?
  • Are decisions around what data to collect on and from children and young people transparent?

Vulnerability – The experiences of vulnerable children can be analysed separately

  • Are the most vulnerable children visible?
  • Is their experience identifiable to ensure that they are not being discriminated against?
  • Do the statistics and data help identify which groups of children and young people are the most vulnerable to having poorer outcomes?

Voice – Statistics reflect the views of children and young people and can be used by them

  • Are the views of children and young people represented in the statistics?
  • Are survey questions asked to children and young people themselves?
  • Do the statistics give them a voice on what is important to them by being understandable to them?

Your views are important to us

The next stage of our review is to test this framework approach with a wider set of users and statistics producers to see if this supports these aspirations. We hope also that sharing our initial thinking now may assist producers in their immediate decisions about what statistics and data they should be collecting and making available during and after the Covid-19 pandemic.

Are you a statistician trying to identify what data to collect and publish?  Would this framework help you in making those decisions? Is there anything else that you feel could be considered? What would be the barriers to ensuring that children and young people are visible in the statistics, that the vulnerable can be separately analysed and that the statistics give children and young people a voice?

Are you a decision or policy maker using statistics to understand the lives of children and young people and the impact of decisions and policies on them? Does this framework cover the key elements that you feel are important?  Is there anything else that you think statisticians should consider?

Are you a researcher using data and statistics to research children and young people’s lives and outcomes and the interventions that impact on them? Does this framework cover the key elements that you feel are important?  Is there anything else that you think statisticians should consider? Are your needs adequately reflected by the framework?

Are you a child or young person or do you represent them? Are visibility, vulnerability and voice the key elements of statistics that are important to you? What are you most interested in when looking for statistics? What makes it difficult for you to find and use statistics?

Please get in touch to share your thoughts with us at regulation@statistics.gov.uk