Improving the value of Housing and Planning statistics in the UK

Gemma Keane, Office for Statistics Regulation, blogs on the outcomes of the Systemic Review of Statistics on Housing and Planning in the UK, and the steps statistical producers are taking to meet user needs.


“How many houses were built in the UK last year?”

“Which part of the UK had the highest number of rough sleepers last winter?”

Finding the answer to these, apparently simple, questions is not easy as there are over 60 National Statistics published on Housing, Planning and Local Services across the UK, produced by 11 different bodies within the four counties of the UK. These range from Housing and Homelessness to Planning Applications and Grassland Fires.

The responsibility for housing and planning policy is devolved across the UK and each country has its own, different legislation in place, making it difficult sometimes to make comparisons or get an overall picture of what is happening.

Topics such as housing and planning are of high public interest and we know that good statistics are vital to policy and service delivery. This is what drove the need for our Systemic Review of Statistics on Housing and Planning in the UK, focusing on the perspective of users, which we published in November 2017.

As well as identifying many areas that demonstrated good practice by the statistics producers we also identified opportunities for improvement, which is why we started our initial engagement with them to support them through the improvement process.

Since then Housing statisticians from the four UK countries have come together to discuss a joint approach to the review’s findings which they have published along with useful blogs, drawing attention to the 5 key areas the programme would be taking forwards – Coherence, Quality, Harmonisation, Accessibility, and Users.

Each organisation has their own set of challenges and it is often difficult to juggle conflicting priorities. However, we encourage producers to prioritise meeting user needs through coherent publications wherever possible. We welcome the most recent update to the Work Programme this week with the accompanying blog from Debra Prestwood (Deputy Director for GSS Strategy Delivery at ONS). These in addition to the previous blog highlight improvements made across the 5 keys areas of the work programme. For example, the publication of experimental statistics on homeless deaths in England and Wales; producing a new experimental Statistical Framework for Housing and Planning Statistics developed in collaboration across the GSS, as a tool for identifying what is being measured; publishing a feasibility report into the harmonisation of homelessness definitions for use in statistics; and priority areas for improvements.

As part of this work programme, ONS published an informative analysis on the UK Private Rented Sector using a range of data sources from across the four UK countries assessing the comparability, coherence and data limitations. We’re pleased that this is the first in a planned series of reports looking at the different topics across Housing statistics.

Importantly, producer organisations are increasing their user engagement with charities, business, academics and other third party organisations – each bringing their own valuable insight – through events like the recent ONS Forum on Housing & the Private Rented Sector, and the recently launched user feedback survey. It’s great to see the recognition of users’ needs in guiding the developments.

Overall, I am reassured by the recent good progress and I hope to see this momentum continue.

Homelessness

Homelessness is an important issue in its own right. It is also an illustration of the concern for public value that underpins the Office for Statistics Regulation.

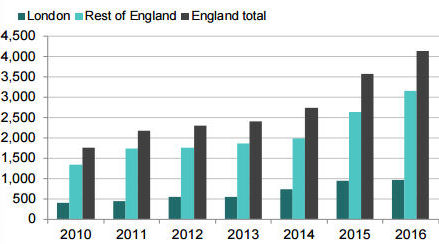
Last week’s publication of DCLG’s estimate of rough sleepers for England generated a significant amount of comment in mainstream and social media. The statistics indicate a continued rise in the estimated number of rough sleepers in England, based on a mixture of local authority counts and estimates for one night in Autumn (between October and November) each year since 2010.

Rough sleeping counts and estimates for England, London and rest of England, autumn 2016

Rough sleeping counts and estimates for England, London and rest of England, autumn 2016

Source: DCLG

“we felt there was a risk of confusion from multiple publications of statistics”

Some of the coverage referred to our work on homelessness. Our assessment, published in December 2015, highlighted the need for a coherent picture of homelessness.

This 2015 assessment represented a crucial moment in developing our focus on the public value of statistics. We judged that public value lies in bringing together separate measures of statutory homelessness, prevention and relief, and rough sleepers. And we felt there was a risk of confusion from multiple publications based on differing definitions, like ‘statutory homelessness’ and ‘prevention and relief’.

We also proposed specific changes, and DCLG has implemented many of these. For example the rough sleeper statistics published last week included for the first time valuable information about the demographic characteristics of rough sleepers in England in response to our recommendations.

We’ve been pleased by DCLG’s work to improve the statistics so far. But the interest in rough sleepers last week bears out our analysis.

For example, on clear definitions, the terms ‘rough sleeper’ and ‘homeless’ are frequently used interchangeably. This may divert attention from the fact that while rough sleepers are the most visible and affecting form of homelessness, there are other groups of people without somewhere permanent to live.

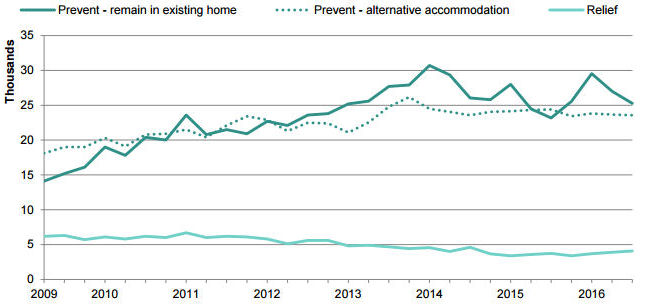
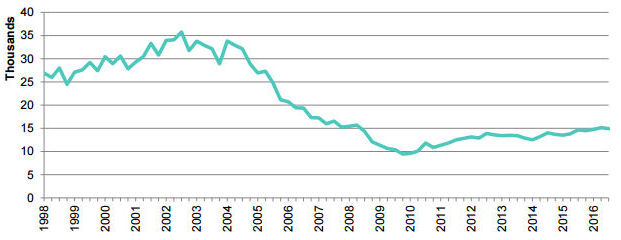
And on integrated publication, DCLG’s rough sleeping figures are published separately from DCLG’s other quarterly homelessness statistics. These statistics show that, along with the rise in the number of rough sleepers since 2010, levels of prevention and relief support have increased over the last decade, while the figures for statutory homelessness have come down.

Cases assisted to obtain alternative accommodation (homelessness prevention and relief), each quarter, to Q3 2016

Cases assisted to obtain alternative accommodation (homelessness prevention and relief), each quarter, to Q3 2016

Households accepted by local authorities as owed a main (statutory homelessness) duty, each quarter, to Q3 2016

Households accepted by local authorities as owed a main (statutory homelessness) duty, each quarter, to Q3 2016

Source: DCLG

“the key is to ensure the statistics reflect the lived experience of the homeless”

The situation in other countries in the UK varies from that in England, as each nation has taken its own approach to homelessness policy. Each is equally complicated, with different criteria for state support and limitations in measuring those not eligible or recorded by the existing systems. And some of the underlying systems of measurement are also changing.

Through all these different approaches, it’s important to remember the human aspect. The key is to ensure the statistics reflect the lived experience of the homeless.

That’s why we have emphasised a more integrated approach. With a fuller picture,  governments, charities and other key decision makers can best support homeless people – and help them find a way out of the extremely difficult circumstances that they face.

Homelessness is an important issue in its own right.

It is also an illustration of the concern for public value that underpins our work at the Office for Statistics Regulation.

Ed Humpherson
Director General, Office for Statistics Regulation
1 February 2017