Updated on 25 January 2024 to correct factual error regarding who publishes official statistics on NHS waiting lists in England: incorrectly listed as DHSC, changed to NHS England
Dear Veronica,
NHS waiting lists in England
Thank you for your letter regarding comments made by the Department for Health and Social Care (DHSC) on NHS waiting lists in England. I am replying as the Head of the Office for Statistics Regulation, on behalf of Sir Robert Chote.
As you note, in an article in the Times on 4 January 2024, a DHSC spokesperson said: “Cutting waiting lists is one of the government’s top five priorities, and despite the impact of strikes, we have cut the total waiting list and the number of individual patients waiting for treatment.”
NHS England publishes monthly official statistics on NHS waiting lists in England. This includes data on ‘incomplete pathways’, which are waiting times for patients still waiting to start treatment at the end of the month, and the number of unique patients on NHS waiting lists.
At the time of speaking, the available official statistics on NHS waiting lists in England showed the total number of incomplete pathways and unique patients on NHS waiting lists fell between September and October 2023. The latest data published on 11 January show that the total number of incomplete pathways and unique patients on NHS waiting lists also fell in November 2023.
It would better support understanding if DHSC had been clear on what time period it was referring to avoid potentially misleading people. This is particularly important where the fuller time series of waiting lists data, as shown in the chart below, show an upward trend in waiting lists over the last year and could therefore be perceived as selectivity of data.
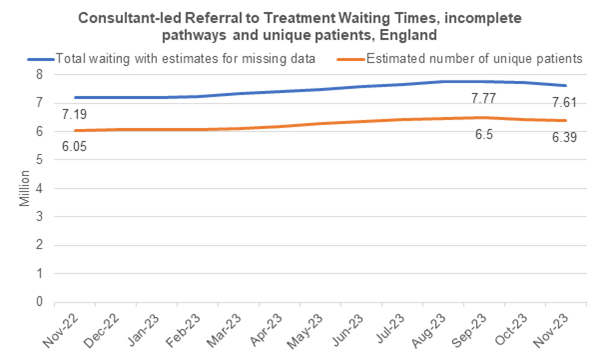
Consultant-led Referral to Treatment Waiting Times Data 2023-24, November 2023
The chart above shows the estimated number of incomplete pathways and the estimated number of unique patients waiting for consultant-led treatment with the NHS in England, from November 2022 to November 2023. The lines in the chart show a steady increase in both from November 2022 until reaching a peak in September 2023, and then falling.
Those speaking on behalf of Government should make it easy for people to understand and verify what data it uses to inform the public. Taking a transparent approach by default ensures confidence in public messaging is not undermined.
Yours sincerely,
Ed Humpherson