Dear Sir David and Mr Humpherson
CPRE Warwickshire
41a Smith St Warwick, CV34 4JA 13 November 2020
Re: POPULATION PROJECTIONS AND MID-YEAR POPULATION ESTIMATES FOR COVENTRY
We are writing to lodge a complaint against the Office for National Statistics for its handling of population figures and projections for Coventry. We believe that both the mid-year population estimates and the population projections for Coventry have been very greatly inflated by ONS without adequate justification or good reason. Our evidence for saying this is presented below.
We ask that UKSA carries out an independent review, for 2 reasons:
- this would be a useful case study of a more general problem – that there is no way of challenging MYEs and SNPP Projections even when there is strong evidence that the method does not fit specific cases well, – because the challenger has to provide an alternative method that could immediately be applied to all Currently there is no way to challenge ONS numbers, and no appeal process. We have appealed to ONS themselves, but do not feel they have ever provided an adequate response.
- There is grave danger that bad decisions – to irrevocably destroy historic countryside – are being made on the back of bad data – which will reduce trust in national statistics and
We believe that this may well be a more general problem. Others around the country, disbelieve the mid year estimates and projections in their local authority area. We would be happy to provide contacts if desired.
Formally, we are asking for an independent review under item T4.6 of the Code of Practice for Statistics:
“T4.6 Independent measures, such as internal and external audit, peer review and National Statistics Quality Reviews, should be used to evaluate the effectiveness of statistical processes. Statistics producers should be open about identified areas for improvement”
Because ONS population projections and associated household projections are used as the basis for forward planning by all local planning authorities, the very high figures for Coventry have led that authority and neighbouring Warwickshire authorities to over-allocate land for housing in their local plans. This has resulted in major incursions into the countryside, both in Coventry itself and in those parts of Warwickshire immediately surrounding it. Large amounts of the historic Forest of Arden – precious for history, biodiversity, landscape, heritage, flood control, recreation and providing the green lungs of a crowded urban area – have been removed from green belt in and around Coventry and allocated to unnecessary housing. It is a case of bad data leading to bad decisions.
We understand that the projections, by their nature, are not forecasts or predictions and can be subject to substantial uncertainty, but local councils treat them is if they are reliable predictions of the future, sufficient for making irreversible and highly damaging environmental decisions. They claim that they are “forced” by government to follow the projections, and have no latitude to depart from them. Local plans are examined by government inspectors, but the latter have shown no inclination to test the meaning and reliability of the projections or to hear evidence about them. They simply take them at face value.
Estimates of Coventry’s Population
The 2011 Population Census provided a reasonably reliable figure of the population of Coventry – some 317,000. ONS have issued mid-year estimates for all subsequent years since then, rising to 371,500 by 2019 – an estimated increase of 54,500 in just 8 years, compared to far smaller growth of only16,000. In the 10 years from census 2001 to census 2011.
We believe that the mid-year estimates for Coventry have been overestimated for the following reasons.
ONS have overestimated the birth rate in the city and underestimated the death rate. Figure 2, shows how this has become more pronounced for births as the years have elapsed since 2011. It affects both the base year estimate of Coventry’s population and the forward projection of the population from that base date.
Births have been declining steadily since 2011 but the 2014-based projections inexplicably have them increasing over time, at a rate faster than that of any other nearby town. The reverse is true of deaths (see Fig 3). More deaths are happening than assumed in the projections, Eight years into the Coventry local plan period which began in 2011, this factor inflates the growth of the city by around 1000/year. ONS has finally (in April 2020) explained their method, which leads to this overestimate, but it still leaves them defending results which are far out of sync with reality. Later projections continue to embody this problem.
Based on information from HESA Destinations Surveys, and the Exit Checks data, we believe ONS has seriously underestimated the amount of international emigration from Coventry – particularly migration of students after their courses are completed. While no one data source is 100% accurate and reliable, we estimate that this could have the effect of exaggerating the growth in Coventry’s population by up to 60,000 over 20 years (equivalent to 19% of the existing population).
The projections are such an extreme outlier that any valid quality control process would consider the possibility that there is a mistake in the method or the data. To our knowledge, no internal or independent quality assurance has been carried out of the population projections for Coventry.
When a very wide range of administrative data for Coventry is examined, it fails to show any sign of exceptional growth in the city. All the vital signs of the town – births, deaths, voters, cars registered, pensioners, school admissions, houses built, benefits claimed, A&E attendances, gas and electricity used, and domestic waste produced -are completely average for the region. We have drawn the attention of ONS to the administrative data, repeatedly, in ever increasing detail, and for ever increasing time periods, yet ONS has steadfastly refused to engage with this data and its obvious conclusions.
ONS’s Response to Our Concerns
We have raised our concerns about Coventry’s population estimates and projections via correspondence, at a meeting on 23 July 2018 (At ONS offices in London, attended by Joanne Harkrader, Neil Park, Andrew Nash, and Andy White) , through the Mayor of the West Midlands, and through local MPs who have supported our concerns. A summary of the issues and concerns raised and ONS’s response to them is attached to this letter [Annex B]. While ONS have responded to our general questions about how population projections are arrived at, they have steadfastly refused to investigate the Coventry projections per se, or to explain why they are so much higher than those of other local authorities in the West Midlands.
ONS repeatedly remind us that the SNPP are projections, not forecasts, that circumstance or policy may change, leading to different outcomes. That is plainly true, but we are not pointing to to the unpredictability of time and politics – We are pointing to something different.
It is our view, that the extreme projections for Coventry may have come from errors in the input data –not from the caprices of events or of policy changes. If the wrong data is going into the model, ONS should put it right. If bad data is allowed to go into the projections, it undermines the whole exercise
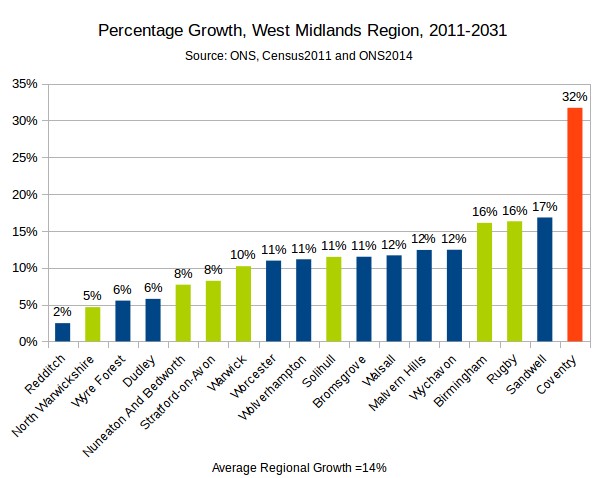
The graph below (Figure 1), and the longer time series in the Appendix, (figures 5 & 6) show the extent to which Coventry is consistently an outlier among West Midlands authorities as regards projected population growth. Coventry’s projected population growth over a 20 year period, according to SNPP2014, is almost three times that of the West Midlands Region as a whole, over three times that of Warwickshire, almost twice that of Birmingham and between five and six times that of the slowest growing authorities in the region. Nothing in the geography or economy of the city justifies these differences. Coventry is a traditional centre of population and employment that has experienced relatively sluggish growth in recent decades. It is not a new or expanded town and there is little room for expansion within the city limits. That its population and employment will now suddenly ‘take off’ defies belief and is against all intuition.
We have looked at this anomaly specifically in the context of the 2014-based population projections because it is those on which the current round of Coventry and Warwickshire local plans are based. However similar issues arise in later population projections and without a reality check the gross discrepancy between projections and reality can be expected to persist. Figures 5 & 6 below, illustrate the persistent nature of the aberrant Coventry projections.
Clearly future projections will need to take into account the impact of the current coronavirus pandemic on a number of factors that underlie the projections. Presumably ONS are already working on these issues, though it is probably too early as yet to judge the overall impact of the pandemic on future population and its growth. But our concerns arose before the pandemic developed and are independent of it.
Uncertainty
We recognise that all mid-year estimates of population and all population projections are subject to uncertainty. ONS helpfully try to quantify this for particular local authorities. We wish to make the following points:
a. Coventry’s margin of uncertainty (as stated by ONS) is much wider than that of other authorities in the West For example the confidence interval as a percentage of the 2019 mid-year estimate is 11.22% in Coventry. For all other local authorities in the West Midlands Region it is between 2 and 6%. This makes the Coventry mid-year estimates unreliable as the basis for the population projections, and hence for forward planning by local authorities.
b.The 95% confidence interval will reflect sampling errors, whereas in the case of Coventry there are clearly systemic errors that go well beyond The Lords Economic Affairs Committee, in July 2017, called the international migration figures “wholly inadequate” and the UKSA said they were “potentially misleading”.
c. ONS make the point that our own estimates of Coventry’s population fall within their confidence We do not accept this point. Our most recent best estimate, which we informed to ONS in April 2020, for Mid Year 2018 was circa 335,000 which does not fall within latest ONS 95% confidence intervals for Coventry.
d. In a letter to Craig Tracey MP (24 May 2019, attached), Rich Pereira, Deputy Director ONS, states that the 95% confidence interval for the 2017 mid-year estimate in Coventry is ±23,500. Put differently, ONS is saying that the true net growth of Coventry from 2011 to 2017 is somewhere between 20,454 and 67,454, a difference of 330%, over just 6 years.
This is tantamount to an admission that the mid-year estimate for Coventry is nearly meaningless, so broad is the 95% confidence interval.
Summary and Conclusions
In the light of the evidence and argument presented above and in the Annexes, we are calling for an urgent independent review of the mid-year estimates and population projections for Coventry. We note that UKSA has required ONS to downgrade migration data to “experimental statistics”.
We ask that the Coventry projections should also be severely qualified and that a public statement should be issued to that effect. Around the country, between 2001 and 2011, no such extreme disparity between one local authority and its near neighbours occurred within a government region, with one exception. (There was a large gap between Manchester population growth and it’s neighbours 2001-11. However, that is understandable because there was a boundary change.)
The projections amount to a claim, that a miracle is likely to occur. Any such claim must be justifiable in the real world – ONS mentions the two universities as a driver of growth, but the numbers do not bear this out. Since 2011, the numbers went down, and then back up again but on balance there was little net change (See Figure 7).
This is fundamental to retaining trust in public statistics. If ONS cannot justify its results, and simply shrugs its shoulders when bizarre numbers appear, there is a grave danger that decision makers, interest groups and the general public will lose trust in national statistics. Even more seriously, it undermines the ability of local and central government and their agencies to plan for public services: to have the right number of schools, surgeries, water and electricity supplies, buses and trains, and hospitals, in the right place at the right time.
Our analysis has been endorsed by highly respected demographers: Prof Tony Champion, Prof David Coleman, Prof Phil Rees and Piers Elias who described it with words like ‘compelling’.
Prof Tony Champion (of Newcastle University) wrote:
‘Your PPT’s challenge to the current set of ONS SNPP seems highly valid to me. I am particularly struck by how out of line Coventry’s projected growth is compared to the other LADs in the West Midlands – indeed, one can extend this to the whole country, as in the Table pasted below: Coventry’s projected increase 2014-2039 of 100,300 is exceeded by 3 London Boroughs and 2 other major cities, indeed the latter description applies to all the top places listed (apart from large unitary of Cornwall). And it is well known that London is a specially dynamic case, and also that the other major cities’ large gains actually translate into much lower % rates of growth than Coventry’s 32.1%. Coventry would thus appear to be a real – and strange – outlier.’
Prof David Coleman of Oxford University writes:
“Mr Gering’s report was very well produced. It shows a thorough knowledge of the data and principles involved and the statistics are well handled. It would not be easy to produce anything better, given the uncertainties in the data themselves”. “Your local analysis is as good as it can be, I think. I’d be happy to recommend your study.’
In July 2019, we published a summary of our challenge in the British Society for Population Studies [BSPS] newsletter, and the editor invited ONS to respond. They have not done so. We have twice presented our work at the BSPS annual conference (in 2018 and 2019). ONS did not respond to any of the detail of our work, only giving bland generalisations, in their 5 minutes allotted for rebuttal. We asked for a detailed written explanation of how they had worked out the projections for Coventry. There was no reply other than a reference to their publications, which do not lay out their methods in sufficient detail for us to reproduce them, nor did they deal with the obvious serious inaccuracies in birth, death, and migration numbers.
On 20 July 2020, ONS, finally responded to our slide show presentation. We are very disappointed with their answer – they did not deal with the 3 pillars of our argument.
- A cause of hyper population growth. There is no identifiable reason why Coventry should suddenly leap into the top league of fast growing In the last census decade, (2001 -11) it was the 228th fastest growing local authority.
- The vital signs of the city, the administrative data, taken cumulatively, show no sign of exceptional population ONS picks at individual datasets as proxies for population, but never examines the heart of the argument: the total lack of any exceptional uplift in any of the Coventry data as compared to its neighbours.
- the birth, death, and emigration components for Coventry in the MYE and SNPP are grossly in error.
Meanwhile, local governments treat ONS projections as if they are divine prophecies and will not deviate from them. Coventry Council insist that they are ‘forced’ to use the ONS projections in their planning process. It is urgent. Coventry Council will not budge unless they see ONS revise their projections, or at least see ONS concede that the numbers need revision. If something does not happen, very soon, in the next few months, large pieces of beautiful countryside will be destroyed forever, for no good reason.
For all these reasons we respectfully ask for an independent review of ONS’s approach to estimating and projecting the population of Coventry.
Sincere Regards,
Sir Andrew Watson, Chair CPRE Warwickshire
Andy Street, Mayor of the West Midlands
Taiwo Owatemi MP, MP for Coventry NW
Zarah Sultana MP, MP for Coventry South
Craig Tracey MP, MP for North Warwickshire
Merle Gering
Chair, Keep Our Green Belt Green, Coventry and Warwickshire
Related Links
Ed Humpherson to Sir Andrew Watson: Review of Population Estimates and Projections produced by ONS (May 2021)