The Statistics Authority’s quality assurance of administrative data standard has three levels of assurance: basic, enhanced and comprehensive.
This case example illustrates basic and enhanced quality assurance of administrative data sources used to produce the Driver and Vehicle Agency’s (DVA) driver and vehicle statistics for the Department of the Environment for Northern Ireland.
Content:
Background to the statistics
The data sources and suppliers
Approach to the quality assurance of the admin data
Outline of DVA’s quality assurance approach
- Determine the level of assurance for each data source by deciding the degree of data quality risk and level of public interest
- Gather information on the four practice areas for each data source from available material held by the statistical team and document the range of activities undertaken to assure the data
- Contact data suppliers for information about their approaches to data quality assurance using a questionnaire
- Identify the strengths and limitations of the statistics taking into account the quality issues
- Develop quality indicators for each source
Background to the statistics
Driver and vehicle statistics are produced by DVA, an agency of the DOE responsible for: vehicle testing; driver testing and licensing; road transport licensing; monitoring of compliance with roadworthiness and traffic legislation; and roadside enforcement.
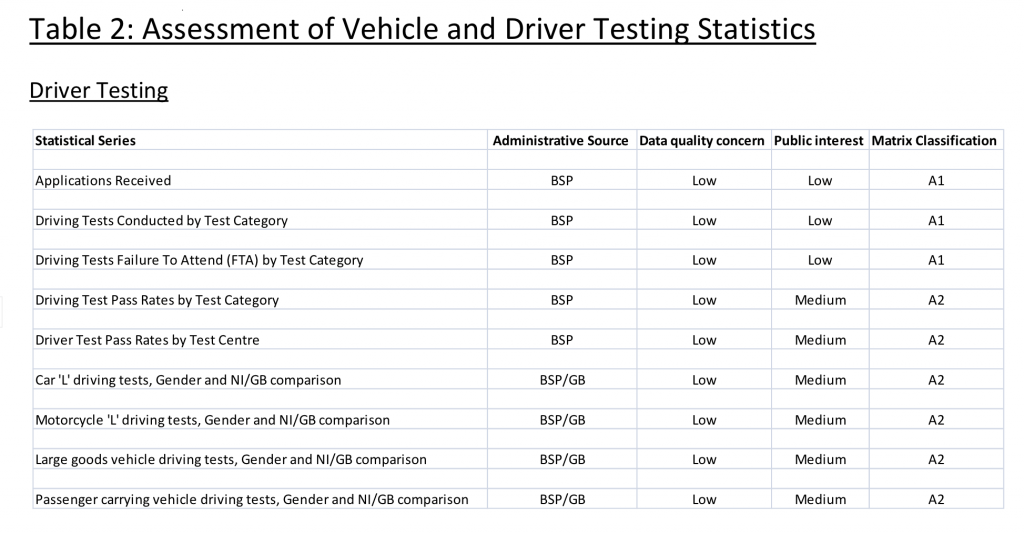
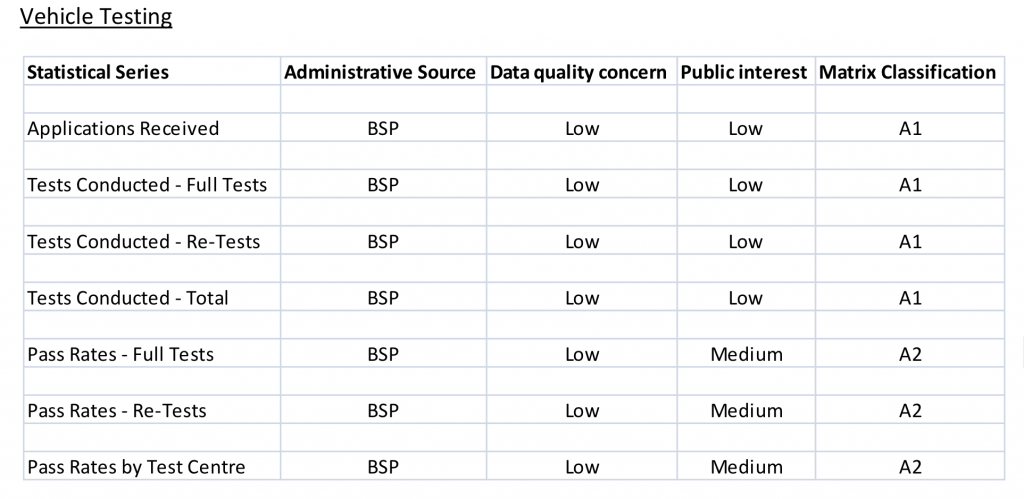
The annual and quarterly statistical reports present statistics relating to each of DVA’s functions – for example, for driver testing, the number of applications and appointments for tests together with pass rates, and include breakdowns by vehicle type and driver gender, and Northern Ireland/Great Britain comparisons. The annual report examines longer-term trends. DOE also publishes supplementary tables on vehicle and driver test pass rates by test centre in support of the annual and quarterly statistics.
The driver and vehicle statistics have a range of uses. DVA uses the statistics to report on Key Agency Targets such as waiting times for driving tests and numbers of compliance checks carried out. DVA and DOE also use the statistics to inform the development of policy and operations. For example, patterns in driving test data and pass rates are regularly reviewed to ensure that DVA systems are free from any systematic bias. DOE also uses vehicle registration statistics to support its environmental policy including around greenhouse gas emissions. Economists and the media pay particular attention to new car registrations as an early indicator of economic optimism and these statistics, together with licensed vehicle stock statistics are also used to examine trends in traffic volumes.
The data sources and suppliers
The statistics are largely produced using the administrative data sources that support DVA’s operations. For example, vehicle testing statistics are based on records maintained by the 15 vehicle test centres in Northern Ireland and driver licensing statistics come from the Northern Ireland Driver Licensing System.
Approach to the quality assurance of the admin data
DVA reviewed each of its data sources using the Authority’s QAAD guidance to determine the level of assurance and the steps in the four practice areas:
- Operational context & administrative data collection
- Communication with data supply partners
- QA principles, standards and checks applied by data suppliers
- Producer’s QA investigations & documentation
Excerpt from DVA’s Data Quality Assessment report:
“To help gather additional supporting information not already available to the statistics producer team, data providers were asked to complete an ad-hoc questionnaire (designed by the producer team), with supporting documentation if available, relating to the processes and quality assurance procedures in place with respect to in-house administrative systems (REX,NIDLS, BSP etc). When these questionnaires were returned, the statistics producer team then arranged meetings with providers to review and collate supporting information to the level of detail consistent with our assessment outcomes (A1 or A2) for these administrative systems. The questionnaire in template form is detailed in Appendix 1 at the end of this report.”
[From DVA’s Driver and Vehicle Statistics in Northern Ireland – Administrative Data Quality Assessment Report, p6]
DVA summarised the data quality processes employed by data providers, as well as describing the operational context, communication arrangements and its own assurance checks. It also detailed the key strengths and limitations of each statistical series for each statistical series to highlight the factors to consider when using the statistics.
DVA produced this assessment of the level of assurance for its vehicle and driver testing statistics:
DVA describes the data collection process and the role of an external vendor in managing the internal administrative database (‘Booking Service Project’ or BSP). Its statisticians have close working relationships with the data suppliers:
“The DVA statisticians are in a unique position in that we are located on site, have direct access to BSP, and are in close proximity to technical and administrative teams responsible for vehicle and driver testing. Any significant issues the statistical producer team may have regarding data quality can be addressed immediately onsite with relevant driver and vehicle testing operational managers. Tailored guidance has also been produced to ensure that data suppliers are aware of their responsibilities under the Code of Practice for Official Statistics, particularly with regard to release practices.”
[From DVA’s Driver and Vehicle Statistics in Northern Ireland – Administrative Data Quality Assessment Report, p14]
A detailed manual sets out the data checks carried out by the data supplier and a dedicated quality manager oversees practice. Internal Audit staff also review the operations and system:
“Internal quality audits – checking for example that BSP business volumetric reports/statistics reconcile and are consistent with financial transactions records. These reconciliations are carried out annually in line with departmental accounting and audit requirements. Errors identified are corrected if possible. Checking procedures may be amended if required and staff retrained but action of this sort has not been necessary to date.”
[From DVA’s Driver and Vehicle Statistics in Northern Ireland – Administrative Data Quality Assessment Report, p15]
DVA also describe its own data assurance techniques for the driver and vehicle testing statistics, which include the use of standardised reporting tools, trend analysis to monitor the consistency of the statistics, and comparisons with other sources to validate the trends, for example, relevant economic indicators or comparisons with equivalent figures for Great Britain.
It set out the strengths and limitations of the driver and vehicle testing statistics (p16):
“Driver and Vehicle Testing Statistics
Strengths
– Vehicle and driver testing statistics derived from the BSP administrative system are underpinned by well established quality assurance procedures, manuals and audit controls as outlined above.
– Statisticians have full access to all vehicle and driver testing systems, data and reports.
– Standard booking procedures and online access controls help to minimise the risk of data manipulation.
– Standardisation of driver and vehicle testing systems across DVA test centres.
– Data suppliers and producers work in close proximity aiding understanding of processes and facilitating resolution of issues.
– Data can often be used as part of the legal process which helps ensure accurate recording should customers challenge test outcomes or make complaints.
Weaknesses
– There is some potential for distortion of driver test outcomes and, to a lesser extent, vehicle test outcomes through inconsistent application of test standards by examiners. However, the DVA proactively monitor test outcomes using robust statistical analysis both within and between test centres. Any evidence of non-random patterns of outcomes are closely scrutinised and DVA management take remedial action should this be required. This is not considered to be a significant issue with respect to data quality.”
Next steps:
DVA is taking an incremental approach. It began with building a full picture of the data sources, data quality issues and identifying the strengths and weaknesses. It then sought further information from data supply partners. It says that its next step is to establish quality indicators, to highlight for users where and how data quality issues impact on official statistics.


