The Statistics Authority’s quality assurance of administrative data standard has three levels of assurance: basic, enhanced and comprehensive.
This case example illustrates basic and enhanced quality assurance of a mix of administrative data sources used to derive the Department for Communities and Local Government’s Indices of Deprivation, which include police recorded crime.
Contents:
Background to the statistics
The data sources and suppliers
Approach to the quality assurance of the admin data
Outline of the Indices of Deprivation quality assurance approach
- Designing the indices to ensure quality
- Appropriate and robust indicators, based on well understood data sources
- Minimise the impact of potential bias and error in the input data sources
- Views of data users
- Audited, replicable and validated processing steps are used to construct the indicators, domains and Index of Multiple Deprivation 2015
- Real world validation of the data inputs and outputs
- Internal and external quality assurance checks
- Additional enhanced assurance of specific data sources
- Roles and responsibilities of the research team and data suppliers
DCLG explains its approach in Chapter 5 of the Indices of Deprivation 2015 Technical Report.
Background to the statistics
The English Indices of Deprivation (IoD) are an important tool for identifying the most disadvantaged areas and for supporting decisions about addressing local needs. They are widely used by central and local government and community organisations to target their services. The Indices also provide a rich dataset that supports further analyses of different aspects of deprivation, providing greater insight into the nature of disadvantage for all users, whether in academia, the voluntary sector, business or the general public.
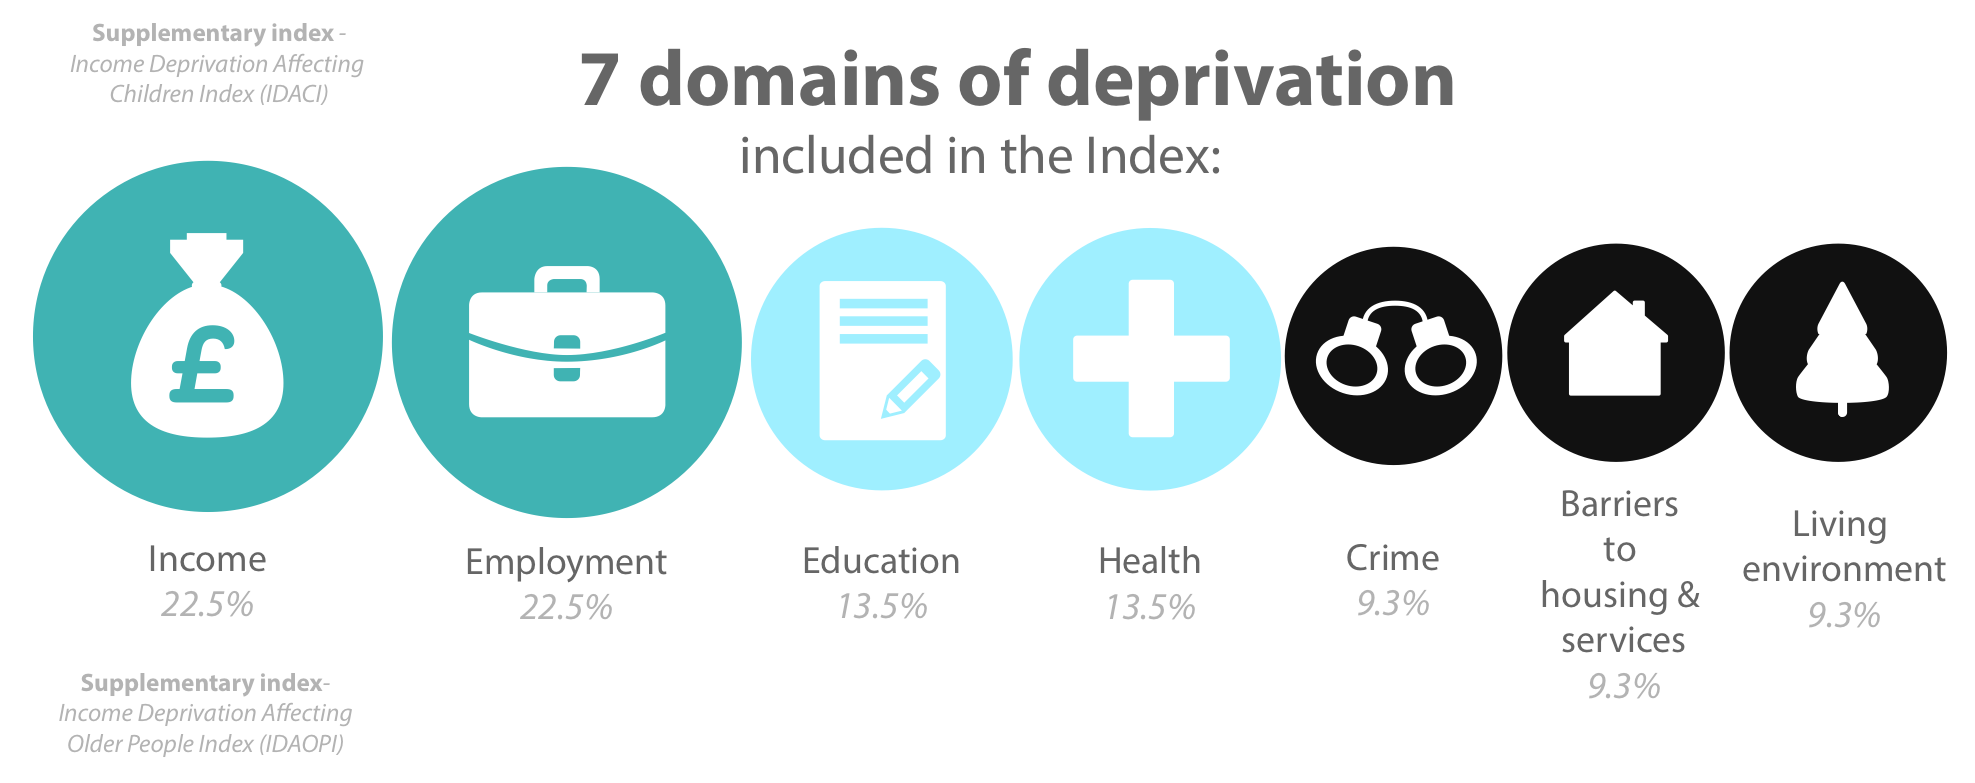
7 domains of deprivation
[From DCLG’s Infographic: The Indices of Multiple Deprivation 2015]
DCLG publishes the English Indices of Deprivation; they include the Index of Multiple Deprivation (IMD). The Indices are an area-based measure of relative deprivation, designed to identify the extent of deprivation within small areas in England. The Indices are comprised of a range of separate indicators, grouped into seven distinct domains: Income, Employment, Education, Skills and Training, Health and Disability, Crime, Barriers to Housing and Services, Living Environment. Each Index represents a different aspect of deprivation.
The Indices compare local areas in England in terms of their individual deprivation by ranking each Lower-layer Super Output Area (LSOA). As each of the seven domains has its own scores and ranks, users can compare the deprivation ranks between different local areas, for each separate domain. The domains are combined in the overall Index of Multiple Deprivation (IMD). IMD allows users to identify the most and least deprived local areas in England, and to rank them.
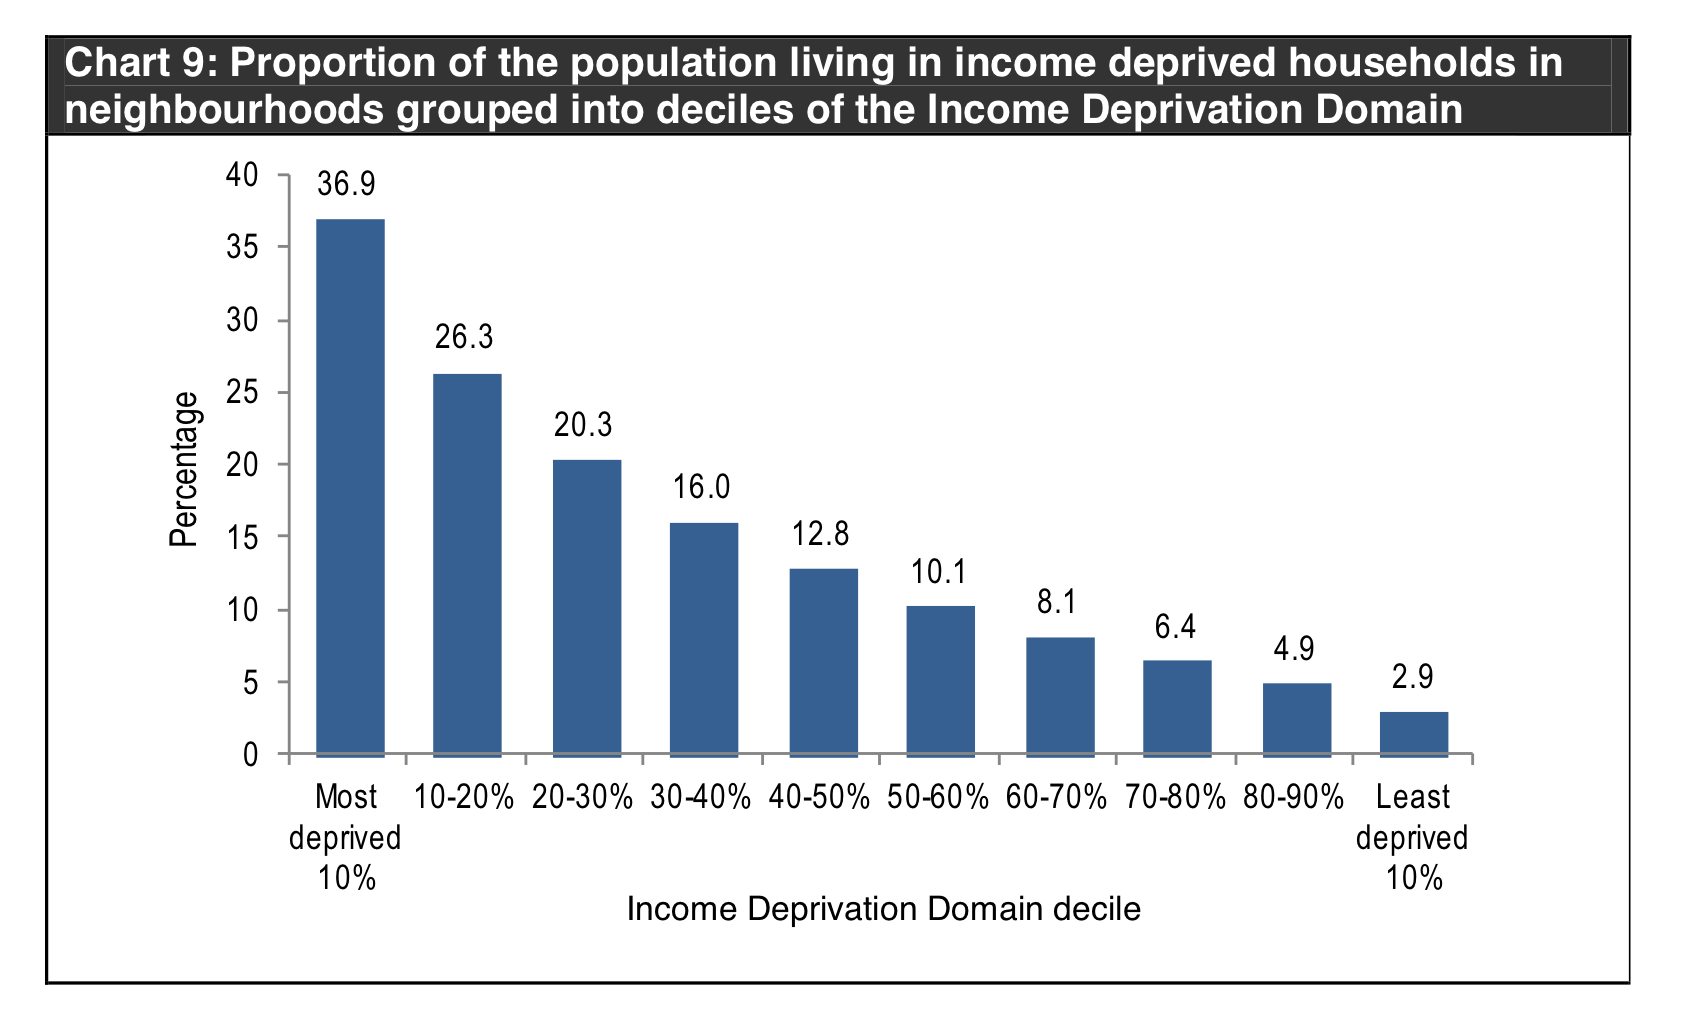
Chart 9: Proportion of the population living in income deprived households in neighbourhoods grouped into deciles of the Income Deprivation Domain
[From DCLG’s statistical release: The English Indices of Deprivation 2015 p20]
The producers
DCLG contracted Oxford Consultants for Social Inclusion (OCSI) to produce the Indices for 2015. OCSI appointed several sub-contractors from the Building Research Establishment and Universities of Edinburgh, York, Cambridge and Staffordshire, to produce specific indicators.
The data sources and suppliers
The Indices are compiled using administrative sources wherever possible. For example, the income domain includes benefit data from the Department for Work and Pensions, tax credit data from HM Revenue and Customs, and asylum seekers data from the Home Office. For some indicators census data need to be used – for example, DCLG used 2011 Census data for IoD 2015 for the adult skills measure of the proportion of the working age population with no or low qualifications and the proportion who cannot speak English well. The IoD team in OCSI obtained event-level police recorded crime data for 2015 from police.uk.
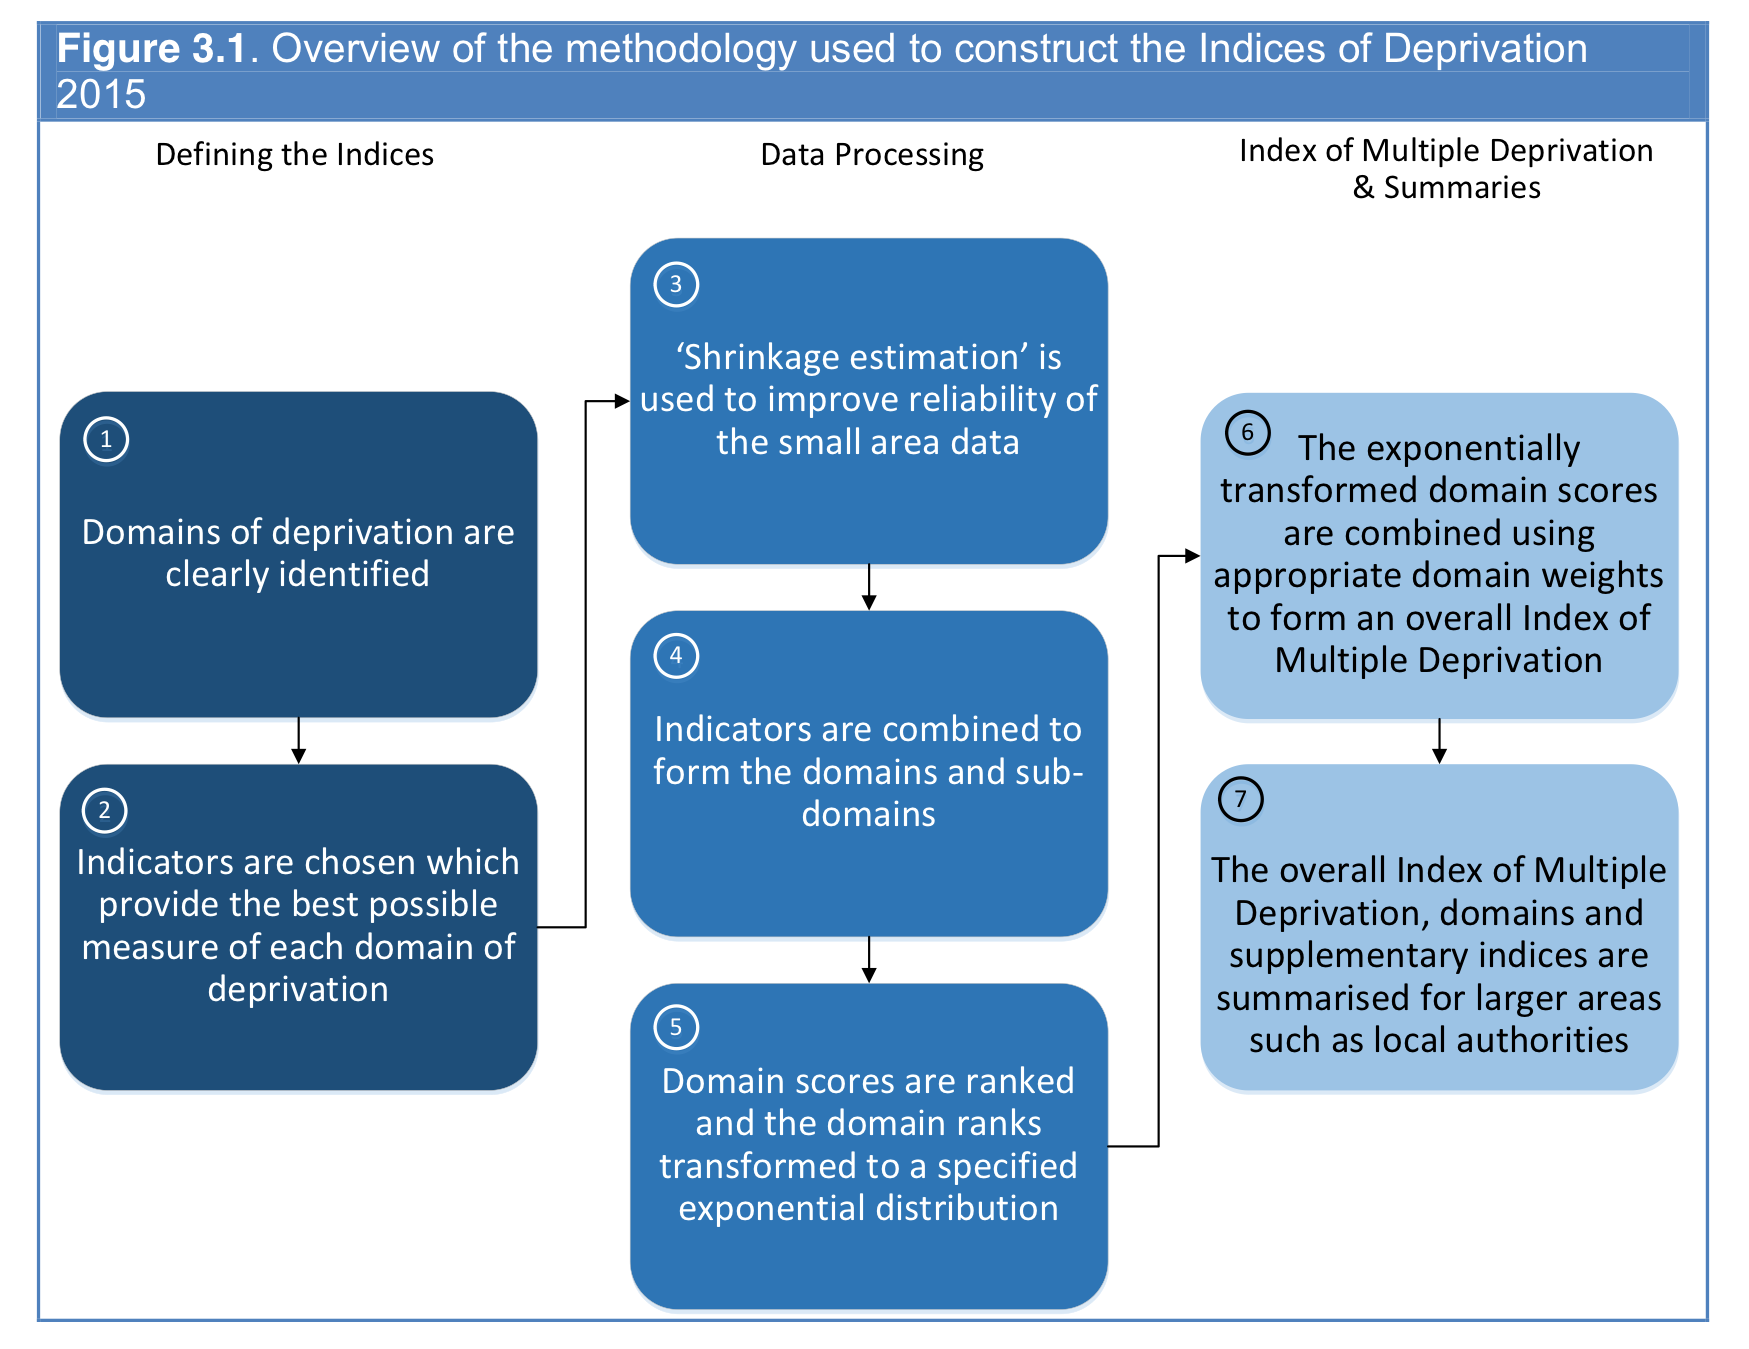
Figure 3.1 Overview of the methodology used to construct the Indices of Deprivation 2015
[From DCLG’s Technical Report Chapter 3 p15]
Approach to the quality assurance of the admin data
OCSI described its approach to quality assurance in Chapter 5 of the Technical Report. It used the Authority’s guidance to decide on the level of assurance for each data source:
Based on our assessment of the Indices inputs and outputs, we have determined the level of assurance required to be as follows:
- Enhanced assurance is appropriate for the overall Index of Multiple Deprivation and higher level summary measures, and a small number of specific datasets: the Crime Domain indicators, the acute morbidity indicator in the Health Deprivation and Disability Domain, and the housing affordability and housing condition modelled indicators. Additional assurance work for these indicators is outlined in Appendix J.3 below.
- Basic assurance is appropriate for the remaining indicators and domains
Provided clear instructions to production team
It provided clear instructions to its sub-contractors on the information required about the source administrative data – check out the slide presentation shared among the production team (see Appendix K of the Technical Report).
OCSI set out its criteria for the decision about the data quality risks for each indicator and the steps taken to assure the data (reproduced below).
| Table J.2 . Our criteria for assessing the level of risk of quality | |
|---|---|
| Summary | · What weight does this indicator contribute to the overall Index of Multiple Deprivation? |
| · Our assessment of level of risk of quality concerns: Low; Medium; High | |
| Operational context and data collection | · Is the indicator published (i.e. open data), in a form that could be used to create the indicator relatively straightforwardly? |
| · If published as open data, is the indicator National Statistics? (i.e. of recognised quality, and with appropriate quality assurance documentation) | |
| · If the indicator is not published as open data, is it based on underlying datasets that are themselves used to generate National Statistics? | |
| · Is the underlying data used for payments (e.g. benefit systems)? (i.e. likely to high quality and regularly audited) | |
| · Is the underlying data used for performance targets (e.g. crime data)? (i.e. risk of performance pressure) | |
| · Is the underlying source data collated from separate sources? (i.e. risk of inconsistent processes across the difference sources) | |
| · Have any statistical disclosure control methods been applied to the data before being provided to us? | |
| Communication with data suppliers | · Is there a single point of contact with the data supplier? |
| · Have the data supplier and project team established appropriate contact points to discuss data supply and quality assurance? | |
| · Has sufficient quality assurance documentation been provided by the data supplier? | |
| Quality assurance principles, standards and checks | · Have concerns been raised by suppliers, users or reviewers over the quality of the indicator or underlying data sources? |
| · If any such concerns have been raised, have these been responded to in the Indices methodology and/ or documentation? | |
| · Do good proxy datasets exist for validating the indicator against real-world data sources? E.g. if the underlying datasets are not published, are any derivatives from the datasets available for our quality assurance validation such as data at local authority district level? | |
[From DCLG’s Technical Report Appendix J pp89-90]
Systematic review of strengths and weaknesses
The team systematically reviewed the strengths and weaknesses of each data source and the impact on the respective indicators. It collated the findings in a spreadsheet for review by the project leads and for internal audit.
Identified specific quality concerns and implications for the statistics
OSCI identified particular concerns with several administrative data sources, including police recorded crime. It made extensive efforts to understand the quality issues and produced detailed guidance for users about the data and their use in producing the Indices.
Appendix J.3 gives the description of OSCI’s judgment about the police recorded crime data and why it is satisfied that they are sufficiently robust for use in producing the crime domain. It describes the results of external audit of the police force data and resulting concerns about completeness and reliability. It also sets out the steps it took to improve the geographic coding of individual records and the nature of the methods used to produce the crime index that minimise the impact of the data quality issues on the statistics.
| Table J.3 . Quality management actions undertaken for quality assurance of the Indices of Deprivation | |
|---|---|
| Quality management area | Actions |
| Manage | · Design of the Indices, including quality of the input data sources; statistical techniques to improve the reliability of small area data; and communication with data suppliers and users. |
| · Clear roles and responsibilities across the research team and data suppliers, and separate internal and external quality assurance checks. | |
| Communicate | · Review of potential data sources with data suppliers, to identify strengths and weaknesses of the data sources and data processing considered for inclusion in the Indices. |
| · Regular dialogue with data suppliers and the research team. | |
| · Documenting quality guidelines and quality assurance for all input data sources used in the Indices (see Appendix L) | |
| · Description of the indicators used in the Indices, including biases and assumptions. | |
| · Engagement with users of the Indices of Deprivation outputs, including 250 responses to the survey on the draft proposals, 100 responses to the final consultation and over 125 attendees at workshops. | |
| Investigate | · Quality assurance of all data sources used as inputs in the Indices, including review of quality processes for administrative and survey data, and modelling methodologies used to develop specific indicators. |
| · Quality assurance of the processing steps used to construct all indicators, sub-domains, domains, the overall Index of Multiple Deprivation, and the higher area level summaries. | |
| · Real world validation of the outputs against data from the previous Indices of Deprivation 2010, as well as appropriate open data sources. This included sense checking of geographic | |
[From Appendix J Technical Report, Indices of Deprivation 2015, pp91-92]