The Statistics Authority’s quality assurance of administrative data standard has three levels of assurance: basic, enhanced and comprehensive.
This case example illustrates comprehensive quality assurance of administrative data used to produce school-level examination statistics for England that are published in DfE’s school performance tables and published for England as a whole in Statistical first releases.
Content:
Background to the statistics
The data sources and suppliers
Approach to the quality assurance of the admin data
Outline of DfE’s quality assurance approach
- Assess the validity of assessment, test and exam results eg through external moderation, unannounced monitoring visits, external marking and monitoring by regulatory, Ofqual
- Assurance of management information, checking validity, coverage, completeness. Incorrect data are returned to the suppliers for correction and resubmission
- Data processing checks are carried out on the full production process through a dry run, to identify any calculation errors and correct any issues prior to live running.
- Further validation checks on real attainment data to ensure statistics have been correctly calculated
- School checking exercise – each school/college checks their own statistics to ensure the correct figures are calculated. All requests for amendment are scrutinised
Background to the statistics
The School-level examination statistics for England show the achievement of pupils and students in teacher assessments, standard tests and public examinations underpinning three stages of education (key stage 2, key stage 4 and key stage 5). These are presented alongside other information in Primary, Secondary and 16-18 at school or college performance tables respectively, within the web-based platform.
The School-level examination statistics, along with the other statistics and information published in the performance tables for England, have widespread use. They are intended by DfE to be used by parents to assess the performance of individual schools, to hold schools to account, and to inform school choice.
The performance tables give aggregated results, presented individually by school or group of schools. Users are able to view information for maintained schools, academies, free schools, and further education colleges with students aged 16-18 in England. At secondary level and 16-18, it is also possible to view the performance of independent schools. Results for all special schools are included in both primary and secondary performance tables. For 16-18 performance tables, special schools that have chosen to be included are listed, as are sixth-form centres or consortia.
The data sources and suppliers
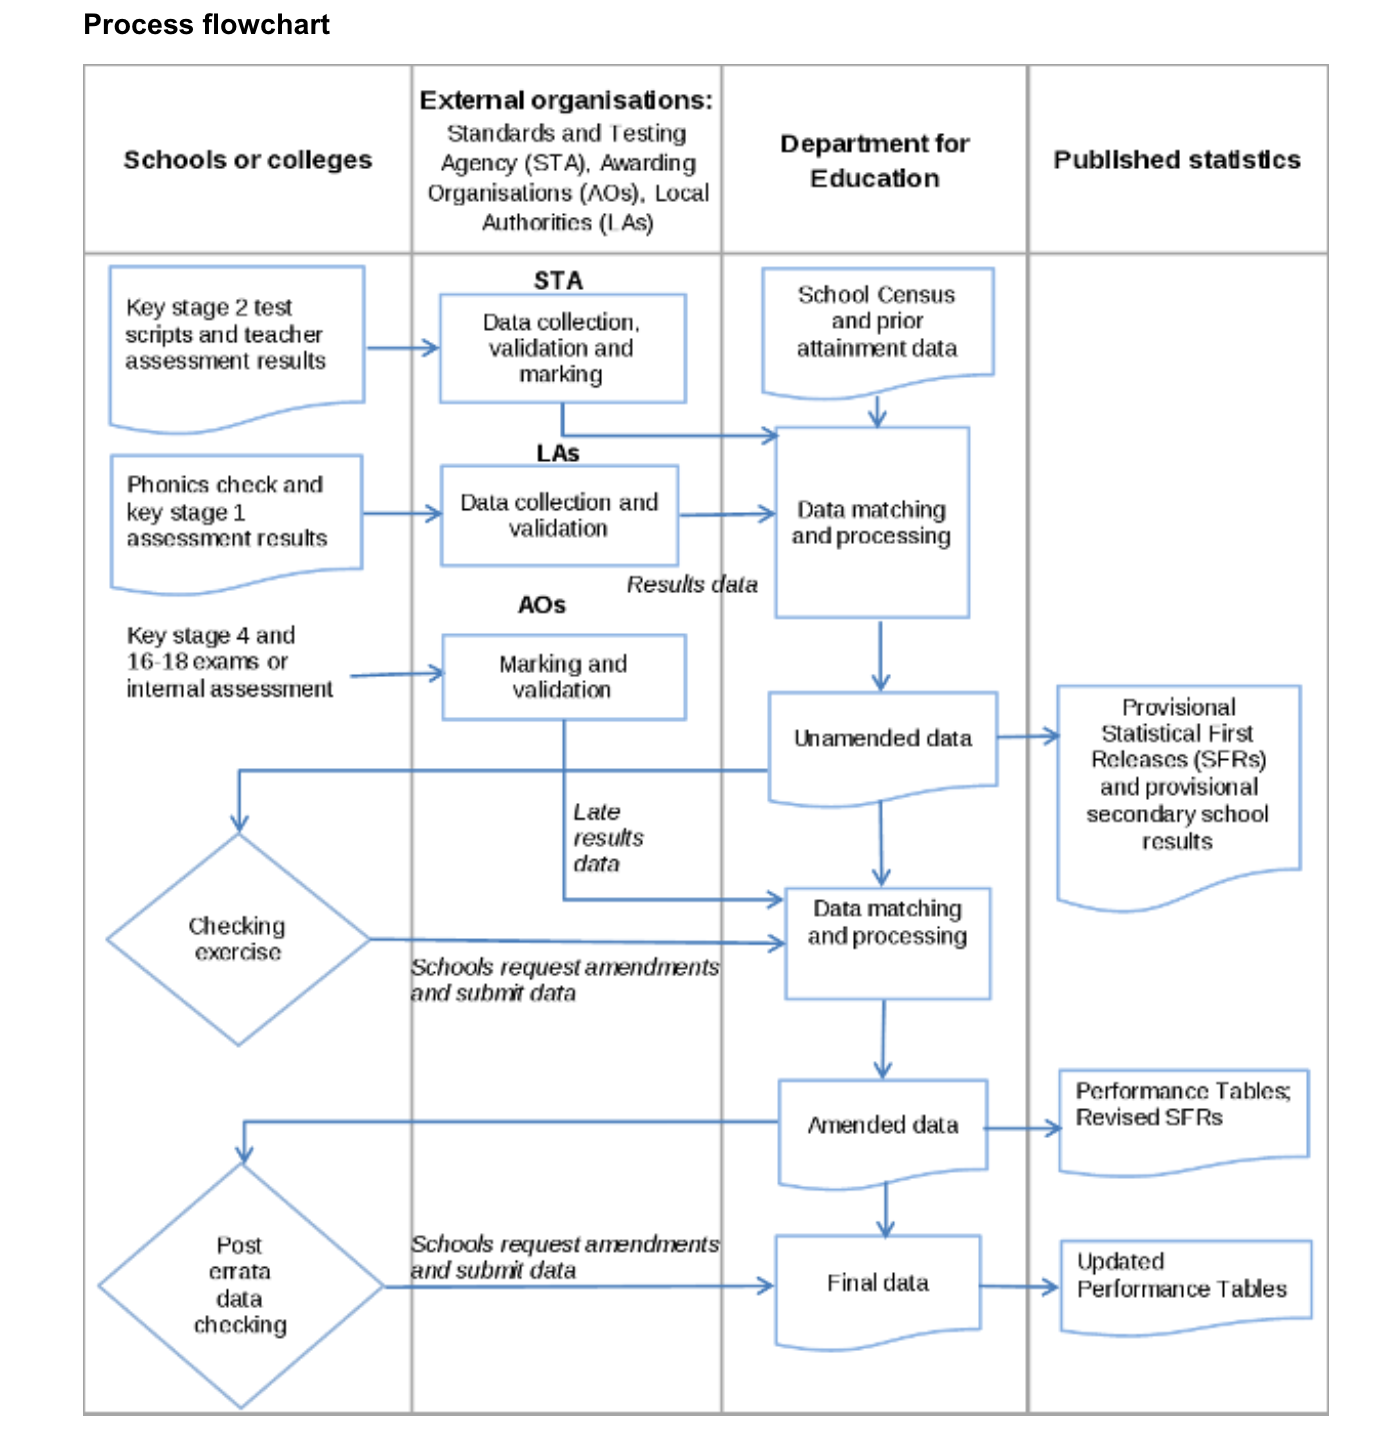
The School-level examination statistics for England are constructed from a number of pupil-level sources. For secondary schools and colleges, exam results collected by the different qualification awarding bodies are linked to characteristics data that schools and colleges provide to DfE as part of the School Census, and are subsequently linked to pupil records in the national pupil database (NPD). For primary schools, key stage 2 assessment results for each pupil are linked to their record on the NPD. A commercial contractor matches pupil characteristics to the test examination results and prior attainment records.
Process flow chart (from DfE’s About Administrative Data web page):
Approach to the quality assurance of the admin data
DfE summarised the different stages and types of checking on its About Administrative Data webpage on the performance statistics website, designed to support parents in using the website. It provides fuller information in detailed quality and methods notes, such as this note accompanying the attainment statistics for primary schools, designed for expert users.
DfE highlights checks carried out at all stages of the assessment, collection and production process, to identify and correct missing or inaccurate information prior to publication.
“Accuracy of assessments: The validity of assessment, test and exam results is assured in a number of ways. At key stage 2, a sample of schools are externally moderated to validate that teacher assessments are accurate and consistent with national standards. STA provides guidance on how schools must administer key stage 2 tests and LAs make unannounced monitoring visits to a sample of schools, to check that the guidance is being upheld. At key stage 4 and 16-18, exams are marked externally by AOs and Ofqual (a non-ministerial department) is responsible for monitoring that exams are delivered successfully and that GCSE/A level grade boundaries are set accurately.
Data transfer: The management information systems that the department uses to collect school census and attainment data all contain validation rules to assess whether the data being submitted is accurate and has full coverage. If errors or issues are identified, these are passed back to the institution or body submitting the data, so that these are amended and the data re-submitted.
Data processing: The performance tables are subject to an annual ‘dry run’, during which the department conducts a full run-through of the data production process using test data. The dry run is used to identify and correct any issues in the calculation of performance measures, in advance of ‘live’ data processing. Once the department receives real attainment data, further sets of validation checks are run to ensure that the data has been calculated accurately.
School checking exercise: The department shares attainment data with schools and colleges as part of a checking exercise. Each school/college can see only the data for their institution, giving them an opportunity to check that we have the correct results for their pupils and to highlight any amendments that are required. All amendment requests are scrutinised, to ensure that the changes are permitted. For example, pupils cannot be removed from the data and grades cannot be changed without an approved reason and valid evidence. Users can find information about whether a school has checked its data on its individual school page in performance tables.”
[From DfE’s web page About Administrative Data]
Here’s an example of steps taken to assure the phonics and key stage 1 data.
Validation and quality assurance of source data
- Once schools have finalised their phonics marks and key stage 1 teacher assessments, they must enter them into their management information system (MIS) which will already contain details of all pupils in each year group. The MIS will include a number of validation rules which check that the data entered is valid and alert the school to correct the data if not.
- Once all results have been entered, the school will instruct the MIS to generate a standard file which they will transfer securely to the LA.
- The LA will check the data before forwarding it to the department.
- The LA must correct any errors before they can approve the data.
- The LA must also ensure that phonics data and KS1 teacher assessments are collected from every expected school.
- The department operates a data collection helpline to assist LAs that are having difficulty submitting data. The helpline will also contact any LAs who they believe may be having problems submitting their data or issue a guidance note to all LAs if the same errors are repeated in many schools data.
- The department monitors the level of returns and the helpdesk contacts LAs with outstanding data as the submission deadline approaches.
Examples of validation rules:
- The phonics mark must be a number between 0 and 40
- Pupils with an outcome of A (absent) or D (did not take) must not have a phonics mark
- Each pupil must have a unique pupil number (UPN) in the correct format
- Each pupil must have only one KS1 assessment for each subject.
Data Processing
The National Pupil Database (NPD) is where the school-level examination statistics data are held, along with a wide range of other data on pupils and schools. Within the NPD, data on pupil’s attainment from the phonics and key stage 1 data collections is linked with information on pupil’s characteristics taken from the school census.
To enable this linking, records are matched, using fields such as surname, forename, date of birth, UPN, gender and postcode. This successfully matches around 60 to 75% of pupils. Additional, more complex, routines are then applied to match as many of the remaining pupils as possible, up to around 98%.
SFR production
All data in the SFR tables is dual run by two people independently. In most cases, different statistical packages will be used by the two individuals.
Any discrepancies in the data produced are discussed and more experienced staff involved as required to agree the correct figures. Additional checks are also carried out on the data produced.
Examples of additional checks
- Comparisons with previous figures to identify any large changes
- Check totals are consistent across tables
- Check patterns in the data are as expected
- Check figures against those produced for the performance tables
Schools and colleges can appeal against their results or identify pupils that should be removed from their roll for the purpose of the performance tables, which may result in individual or entire cohort changes.
To ensure that the performance tables take account of such changes, there are school checking exercises prior to publication, during which schools can report such amendments to DfE. This results in a ‘revised’ dataset, used to produce the initial publication of performance tables.
There is also a further six week ‘errata’ period following initial publication, during which schools and colleges can report any amendments to DfE. This results in ‘final’ data, which are subsequently published in the performance tables.