2. Introduction
Measuring the population using the current cohort component method
Mid-year estimates
2.1 Measuring the size of the population accurately is an essential part of understanding different aspects of our lives and communities. It is also inherently challenging. ONS publishes annual mid-year estimates (MYEs) of the population of England, as well as annual population estimates for Wales. The statistics are used extensively by a wide range of users for different uses. They provide insight into the size and location of the population across the UK and feed into a range of other datasets, for example as a denominator in labour market statistics. In turn, MYEs are used to underpin important operational and policy decisions, both at a national and local level.
2.2 The annual MYEs are produced from data on four aspects of the population, namely stock, births, deaths, and migration:
a) Stock (the size of the population on a given day) is taken from the census. Estimates are rolled forward to 30 June (mid-year), and for consecutive years between censuses.
b) Birth data are obtained from birth registrations. ONS publishes birth statistics for England and Wales. ONS also publishes UK birth figures.
c) Death data are obtained from death registrations in constituent countries, similar to birth registrations.
d) Migration data include estimates of both international and internal An international migrant is defined as a person who changes their country of usual residence for a period of at least one year. Internal migration estimates account for the movement of people within England and Wales and to or from the rest of the UK (cross-border flows).
2.3 Finally, adjustments are made to account for special population groups, such as prisoners and armed forces, that are not captured by the internal or international migration estimates.
2.4 ONS also collates data from NRS and NISRA to produce population estimates for the UK. Estimates for each of the UK constituent countries are compiled using a common methodological approach with the aim to be as consistent as possible.
The cohort component method
2.5 To produce the MYEs, ONS takes data from the most-recent census, and rolls them forward to 30 June (mid-year) to determine the population stock. ONS then updates the MYEs for population change (also known as population flow) using births, deaths and migration data. This method is referred to as the cohort component method and accounts for a full-year’s population change between 1 July and the subsequent 30 June. However, in census years, the MYEs instead account for the change between the day the census was conducted (for example, 21 March 2021) and mid-year (30 June 2021), a period of three months.
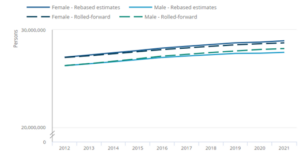
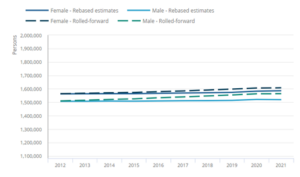
2.6 Between censuses, the estimates tend to drift as the baseline becomes increasingly out of date until they can be rebased again using data from the next census. So the more time that has passed since the last census took place, the less accurate the estimates. For example, in November 2023, ONS rebased its MYEs (2012-2021) once data from Census 2021 for England and Wales became available and revised the back series of components of population change, as depicted in the charts below. In England, this led to an increase in rebased estimates for females and a decrease for males compared to the rolled-forward MYEs. In Wales, rebased estimates decreased the number of both males and females compared to the rolled-forward estimates.
Comparison between rolled-forward mid-year population estimates and rebased back series by sex, England, 2012-2021
Comparison between rolled-forward mid-year population estimates and rebased back series by sex, Wales, 2012-2021
Source: Figures 5 and 8 – ONS website.
2.7 This rebasing is standard practice and conducted by ONS as part of the current system to estimate the size of the population, with benchmarking against the census every 10 years. Most of the revisions made have been for net international migration flows as a result of improved methods and data over time.
The proposed new method using the Dynamic Population Model
Globally, ONS is at the forefront of developing official population estimates using a Bayesian statistical model
2.8 To make more use of administrative data and technological advances, ONS has developed Admin-Based Population Estimates (ABPEs) for England and Wales using a new method to produce population statistics, namely, the Dynamic Population Model (DPM).The Dynamic Population Model (DPM) is a ground-breaking approach that aims to improve the way that population statistics are produced. It uses a Bayesian demographic accounts approach, developed by Bryant and Graham (2013). We understand that ONS is the only example of a National Statistical Institute using this method to develop official estimates of the population. As a statistical model, the DPM uses a range of data sources to produce a coherent estimate of population counts (stock) and changes (flow) using births, deaths and migration data. In line with ONS’s broader ambition to make more use of administrative data, the DPM uses data sources that are supplied by other government departments and public agencies, as detailed in Annex A.
2.9 ONS has shown commendable ambition to revolutionise the way that population statistics are produced. We expect that the DPM will influence population estimation methods globally, and we look forward to seeing how ONS’s progress in this area evolves and matures over time. Ultimately, ONS intends to replace the MYEs with the ABPEs. The stock data are updated annually using administrative data sources, and the model can produce timelier estimates compared to the current approach.
Admin-based population estimates
2.10 ONS has released a series of publications labelled official statistics in development, which use the DPM to generate mid-year population estimates; these are the ABPEs. Estimates of the population in England and Wales are provided by age, sex and local authority. These publications also describe the evolution of ONS’s research and developments in methodology and data sources. ONS intends to replace the cohort component method with the DPM as the primary method for producing mid-year estimates. Like the MYEs, the data sources used as inputs use a mid-year date (30 June) for the reference year.
The DPM and data inputs
2.11 Based on theory outlined in ‘Bayesian Demographic Estimation and Forecasting’ (J.Bryant, J.L.Zhang, 2020), ONS, in collaboration with academic experts, has researched and developed the DPM to produce estimates of the population in England and Wales. The model aims to produce a demographic account using a Bayesian statistical model and create a coherent set of population estimates; it is designed to allow flexibility in managing changeable data inputs and overcome potential data flaws (such as inaccuracies and missingness). The DPM requires an unbiased stock measure over time and a deep understanding of the quality of the data inputs to produce robust estimates with credible intervals.
2.12 In Bayesian inference, a probability distribution (posterior) is produced that summarises the uncertainty of the unknown variable of interest (in this case, ABPEs by age-sex-LA-year) conditional on observed population counts that are measured with error. Bayesian modelling requires a joint probability model of the data and the unknown quantities, and necessarily rests on many assumptions – these need to be transparently communicated, and their influence on uncertainty should be explored.
The Statistical Population Dataset: stock data
2.13 The Statistical Population Dataset (SPD), which is based on linked administrative data, is the main stock measure and an approximation of the usual resident population of England and Wales. The stock data are updated annually using more-recent administrative data sources, therefore, in principle, reducing the likelihood of any rolled-forward errors and potential drift over time, as currently seen in the MYEs.
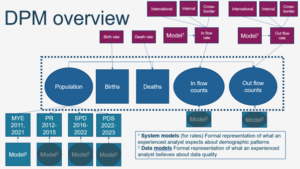
2.14 The SPD is created from the Demographic Index (DI), a composite data source built from a range of admin data sources using cuts of data. The stock data used in the DPM change over time, as shown in the chart below. Census-based MYEs (rolled forward to 30 June) were used as the stock for the census years 2011 and 2021. NHS Patient Register (PR) data were used as the stock between 2012 and 2015, before the introduction of the SPD in 2016.
Source: unpublished chart provided by ONS, 2024
The above image is a visual representation of the DPM. At the centre are the components of population used in the DPM, namely the population stock (blue circle), births and deaths (each represented by a blue box) and in flow counts and out flow counts of migration (each represented as a blue circle). Underneath the population stock (blue circle), there are four smaller boxes representing the different data sources used over time, namely the MYEs for 2011 and 2021, Patient Register between 2012 – 2015, Statistical Population Dataset between 2016-2022 and Personal Demographics Service between 2022-2023. Underneath each of these boxes, there are further individual boxes representing the data models which represent what an experienced analyst believes about data quality. The same boxes (data models) are also displayed underneath the in flow counts and out flow counts of migration. At the top of the chart, there are a number of purple squares linked to the components of population change at the centre (births, deaths, in flow counts and out flow counts). Individual purple boxes linked to ‘births’ and ‘deaths’ represent the rates. For in flow counts and out flow counts, rates are also calculated and are shown in individual purple boxes. A further purple box with an arrow pointing towards the in flow and out flow rates represent the system models. This is a formal representation of what an experienced analyst expects about demographic patterns. Finally, there are three purple boxes attached to the individual in flow rate and out flow rate boxes, representing the components of migration, namely international, internal and cross-border.
2.15 The SPD is subject to limitations and bias. It is subject to under-coverage, with some people missing on administrative records, or not showing any signs of activity on their records that indicate their presence. It is also subject to over-coverage with some people being counted as present in England and Wales despite having moved to a different location. Therefore, a benchmark is needed to adjust the SPD to overcome bias caused by over-coverage and under-coverage. Currently, coverage ratios are derived from Census-based MYEs 2011 and 2021 data.
Births, deaths and migration data
2.16 Changes in the population for provisional and updated ABPEs are caused by births, deaths and migration (which includes international migration, internal migration and migration to or from England and Wales to other countries within the UK). Understanding the quality and the source of any uncertainty in the data inputs is a crucial part of the Bayesian approach. In terms of data input for the DPM, ONS considers births and deaths data to be the most accurate, given that they are sourced from registrations data.
2.17 On the other hand, migration, which accounts for the largest proportion of population change, is the component with the most uncertainty. Long-term international migration (LTIM) estimates, which are currently labelled as official statistics in development, are undergoing transformation following the move away from the International Passenger Survey (IPS) as a data source. ONS had planned to move away from the IPS due to quality issues exacerbated by the COVID-19 pandemic because of the difficulty of collecting face-to-face data and led to the IPS’s suspension in March 2020. At present, three main data sources are used to produce migration estimates for different groups of migrants:
a) Home Office Borders and Immigration (HOBI) data for non-EU nationals
b) Department for Work and Pensions’ Registration and Population Interaction Database (RAPID) for EU nationals
c) the IPS for British Nationals
2.18 Measuring how people move within the UK, also known as internal migration, is inherently challenging. To determine how people move within countries, ONS estimates internal migration using GP registration data from the Personal Demographics Service (PDS) and Higher Education Student Agency (HESA) Cross-border moves between England and Wales, and Scotland and Northern Ireland, are agreed with NRS and NISRA.
Wider population and migration statistics transformation
2.19 ONS ran a consultation on the Future of Population and Migration Statistics in England and Wales from June to October 2023.The consultation was designed to provide ONS with information on how people currently use population and migration statistics and gather user feedback on ONS’s proposals for the future development of these statistics. ONS published a consultation update in December 2023 which detailed who responded to the consultation, how ONS engaged with users of population and migration statistics and how ONS carried out its analysis of responses. The user responses gathered during the consultation will inform a recommendation from the UK Statistics Authority to the UK Government on the advice of the National Statistician. It will be important for ONS to address the needs of the Welsh Government as a primary stakeholder, as it develops its plans for the transformation of population and migration statistics in England and Wales. We are pleased to hear that ONS is engaging with the Welsh Government to keep it informed of its plans, and we expect this positive practice to continue.
2.20 At present, the future of the census, as considered in the ONS Future of Population and Migration Statistics (FPMS) programme, is uncertain. Irrespective of decisions about the census, for the purpose of this assessment, we focus on the extent to which the ABPEs meet the professional standards set out in the Code of Practice for Statistics as a statistical output. Our judgements are based on how the statistics are currently compiled, quality-assured and presented.
Back to top


