
Annex 4: Additional information on survey response rates
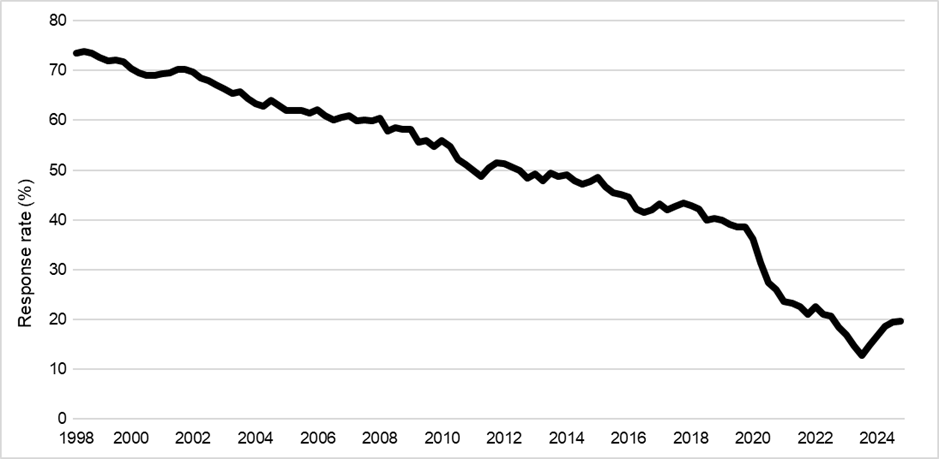
The long-term trend in the response rate for the Labour Force Survey (LFS) is shown in Chart A4.1. Data are only available for the period from 1998, but from this point onwards the chart shows a broadly similar decline to that seen with the Living Costs and Food Survey.
Chart A4.1. Response rate for the UK Labour Force Survey.
Response rates to the Wealth and Assets Survey have also been adversely affected by the pandemic, but again, the medium-term trend shows a reduction that pre-dates the crisis – see Chart A4.2.
Chart A4.2. Response rates to Wealth and Assets Survey.
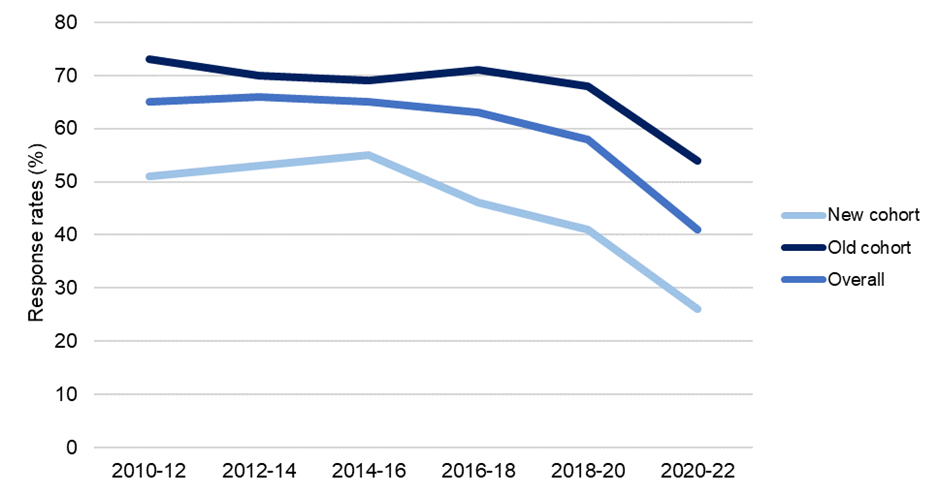
Source: Office for National Statistics. The Wealth and Assets Survey, also known as the Household Assets Survey, is a longitudinal survey, where respondents are re-interviewed in each (two-year) period. Newer cohorts are added in each round to mitigate the issues that emerge from attrition – specifically, lower sample sizes over time and non-response biases.
A broadly similar pattern is observed with the Family Resources Survey, which, although operated by ONS, is funded by the Department for Work and Pensions. Response rates feel from around 65–70% in the mid-1990s to 50–55% in the years prior to the pandemic and 25% in 2022/23.
The USA also provides evidence of downward trends across voluntary household surveys, again pre-dating the pandemic in many cases, although the available data only cover the medium term (see Chart A4.3).
Chart A4.3. Response rates for USA household surveys.
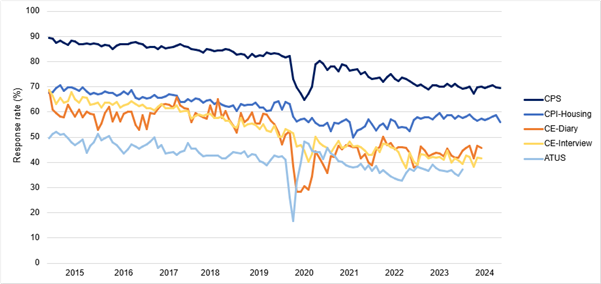
Source: Bureau of Labour Statistics (BLS). Chart shows response rates for the main BLS household surveys: the Consumer Expenditure (CE) diaries and interviews; the Central Population Survey (CPS); the Consumer Price Index-Housing (CPI-Housing) Survey; and the American Time Use Survey (ATUS).
Chart A4.4 shows response rates for ONS’s Annual Business Surveys, for which completion is mandatory. The chart shows that response rates for all surveys decreased during the COVID-19 pandemic, and have subsequently recovered, but remain below pre-pandemic levels. Note that these data are provisional.
Chart A4.4. Response rates for ONS annual business surveys.
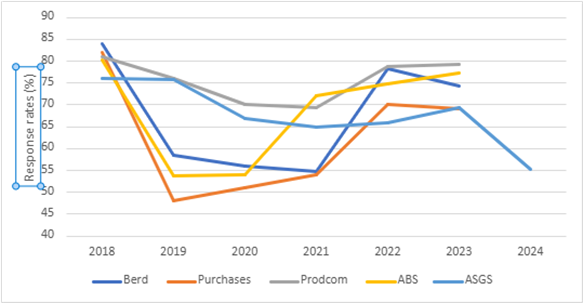
Source: Office for National Statistics (unpublished provisional data).
Notes:
-
Dates refer to the reference year, not the year of collection, which is typically the subsequent year. Data collection for ASGS 2024 is incomplete.
-
Berd – Business Enterprise Research and Development Survey; Purchases – Annual Purchases Survey; Prodcom – UK Manufacturers Sales by Product Survey; ABS – Annual Business Survey; ASGS – Annual Survey of Goods and Services.
Back to top