Guest Blog: Improving ethnicity data quality in the public sector

Introduction

I am the Chief Statistician in the Cabinet Office. I also lead the Equality Data and Analysis Division in the Cabinet Office’s Equality Hub.

One of my roles is to improve the quality of ethnicity data across government departments.

The Standards for Ethnicity Data

In April 2023, my team in the Equality Hub published a set of Standards for Ethnicity Data.

This followed a consultation on a draft set of standards last summer. We also published an analysis of the consultation responses.

We committed to publish the standards in response to action 6 of the Inclusive Britain report — the government’s comprehensive response to the Commission on Race and Ethnic Disparities:

“To ensure more responsible and accurate reporting on race and ethnicity, the Equality Hub will, by the end of 2022, consult on new standards for government departments and other public bodies on how to record, understand and communicate ethnicity data.”

The standards describe best practice for the:

  • collection of ethnicity data
  • analysis of ethnicity data
  • reporting of ethnicity data

Noteworthy aspects of the standards

Elsewhere I have described 5 noteworthy aspects of the standards:

  • They are topic-specific data standards
  • They reflect the Code of Practice for Statistics
  • They also relate to the different stages of research
  • The standards apply to government departments and public bodies
  • We want to understand the use and impact of the standards

Important areas of data quality

I know there is much good practice in departments and other organisations that produce ethnicity data. But there are areas where the standards can have a big impact on the quality of ethnicity data. Four areas in the standards that are important are:

1. Not using the phrase ‘BAME’ (or ‘BME’) in outputs

These phrases emphasise some groups and exclude others, such as white minority groups and mixed ethnicity groups. The standards talk about the importance of using the correct language – the Equality Hub also provides advice on how to write about ethnic groups.

2. Using harmonised standards for ethnicity data as much as possible

The Government Statistical Service team in the Office for National Statistics leads cross-government work on developing and maintaining harmonised standards. Using harmonised standards helps improve the coherence and utility of public sector data. We also encourage the use of as many detailed ethnic groups as possible in outputs.

3. Understanding the level of missing ethnicity data in data collections

This is an important indicator of data quality. Some datasets have high levels of missing ethnicity. For example 19% of prison officers had unknown ethnicity in 2020. Also, the percentage of prison officers with unknown ethnicity changes every year. For example, it was 9.8% in 2015, and 30.1% in 2019. This makes it difficult to make reliable generalisations about changes over time, and has a big impact on how the data can be used and understood. Reporting on the level helps users interpret ethnicity data better.

4. Analysing and reporting on ethnicity data by controlling for other demographic factors.

The ONS has done some sophisticated work in this area. We understand that undertaking regression analysis is not always going to be possible. But users can be particularly interested in deeper analysis and clearer context of the data. Understanding the impact of factors other than ethnicity can be helpful for them. For example, could differences be due to where people in some ethnic groups live? Could they be due to differences in age structure, or an imbalance in the number of men and women in a survey sample?

This sort of contextual analysis is something the Equality Hub is starting to do for the Ethnicity facts and figures website as part of action 8 in the Inclusive Britain report.

Promoting and encouraging use

I am now at the stage of:

  • promoting the standards
  • encouraging their use
  • thinking about how to understand their impact

This will help the Equality Hub meet our aim of ensuring more responsible reporting of ethnicity data.

I have emailed statistical Heads of Profession in government departments about the standards. I have been invited to speak to analysts in some departments, and I would like to do so in other departments.

OSR is helping us with understanding the use and impact of the standards. For example, they will:

  • develop guidance for reviewing data producer compliance with these standards when they carry out assessments.
  • review different data producers’ statistics in one or two years’ time to see how producers are responding to the standards.

If you’re in a public sector organisation and would like to discuss the standards, please contact me at richard.laux@cabinetoffice.gov.uk.

Guest blog: Adding value to ethnicity facts and figures

In our latest guest blog, Richard Laux, Deputy Director, Data and Analysis, at the Race Disparity Unit, discusses the proposed changes to the Ethnicity facts and figures website, for which a consultation was launched today. The consultation will gather views about how users of Ethnicity facts and figures understand the drivers and factors behind disparities, minimising the risk of misinterpretation and incorrect conclusions being drawn – and in turn adding value, as defined in the Code of Practice for Statistics.

 The consultation is in response to Action 8 in the recently published Inclusive Britain report.

The Ethnicity facts and figures website was launched in October 2017. The intention was to increase awareness of disparities in outcomes and experiences between ethnic groups to stimulate debate and, in turn, action to reduce disparities. User research pointed to the importance of presenting the ‘raw’ unadjusted data and descriptive commentary, with no modelling and no attempt to ‘explain’ disparities; also, to adopt a common format and layout throughout.

Over 4 years later the context in which people think about ethnic disparities, and hence the user need for information, has developed. The research conducted to inform the report of the  Commission on Race and Ethnic Disparities (to which Inclusive Britain was the Government’s response) pointed to a need to try to better focus on understanding disparities and outcomes for specific ethnic groups.

We are proposing three changes to the website to achieve this new goal. The consultation itself, and all three proposed changes, are firmly rooted in two of the Code’s principles that are about value:

  • relevance to users -”users of statistics and data should be at the centre of statistical production; their needs should be understood, their views sought and acted on, and their use of statistics supported” (V1).
  • innovation and improvement – “statistics producers should be creative and motivated to improve statistics and data, recognising the potential to harness technological advances for the development of all parts of the production and dissemination process”. In particular, “users should be involved in the ongoing development of statistics and data, exploring and testing statistical innovations, so that the statistics remain relevant and useful” (V4.3).

The first proposed change is to provide different levels of information for different measure pages. For example, we think it is sensible to reduce the amount of commentary, charts and additional analytical splits for pages that are not accessed frequently. And we think we can make some data more accessible by combining measure pages on related topics, such as pupil performance at each Key Stage. We see this as being consistent with the following aspects of the Code:

  • Statistics, data and related guidance should be easily accessible to users. The needs of different types of users and potential users should be considered when determining ways of presenting and releasing the statistics and data (V2.2)
  • Statistics, data and explanatory material should be relevant and presented in a clear, unambiguous way that supports and promotes use by all types of users (V3.1)
  • Statistics should be accompanied by a clear description of the main statistical messages that explains the relevance and meaning of the statistics in a way that is not materially misleading. They should be illustrated by suitable data visualisations, including charts, maps and tables, where this helps aid appropriate interpretation of the statistics (V3.2)

The second proposed change relates to those measure pages which present data according to a binary classification – for example, ‘white’ and ‘other than white’. Such data splits are sometimes shown because small sample sizes or populations do not allow for data to be shown for more than 2 ethnic groups, but this type of data is not useful because it does not distinguish between diverse experiences within or across particular ethnic groups. We are proposing to work with the relevant Departments to provide more detailed ethnicity classifications before updating these measure pages. We see this as being consistent with the following aspects of the Code:

  • Statistics, data and metadata … should be released at the greatest level of detail that is practicable to meet user needs (V2.4)

The third proposed change is to provide additional analysis and context about priority topics through short summaries and links to wider government and academic research. For example, we may provide: the results of regression analysis (where appropriate) to demonstrate the extent to which disparities may be accounted for by factors other than ethnicity, research into geographic variations, contextual information, such as ‘pipeline’ effects, and links to other research, including academic papers and qualitative investigations.

This will help users to understand the drivers and factors behind disparities – minimising the risk of misinterpretation and incorrect conclusions being drawn, and providing better evidence for targeting interventions and resources. We see this as being consistent with V3.2 (as above) and also:

  • Comparisons that support the appropriate interpretation of the statistics, including within the UK and internationally, should be provided where useful. Users should be signposted to other related statistics and data sources and the extent of consistency and comparability with these sources should be explained to users (V3.3)

We are also working on a further refinement of our statistical activity underpinning the website. This does not impact on users, so is not part of our consultation. But we hope that the use of new technologies – Reproducible Analytical Pipelines – will simplify the way we update data on the website, freeing up our resources to conduct value added work such as analysis to help understand disparities, and reducing the burden on the Departments that provide us with the data. We think this is consistent with the following aspects of the Code:

  • Statistics producers should keep up to date with developments that can improve statistics and data (V4.1)
  • Statistics producers should be transparent in their approach to monitoring and reducing the burden on those providing their information, and on those involved in collecting, recording and supplying data (V5.5)

If you have views on the presentation of ethnicity data, I encourage you to complete our consultation.


Guest blog: Improving reporting and reducing misuse of ethnicity statistics

Richard Laux, Deputy Director, Data and Analysis, at the Equality Hub discusses his team’s work in improving reporting and reducing the misuse of ethnicity statistics in our latest guest blog, as part of the 30th anniversary of the United Nations’ Fundamental Principles of Official Statistics.

In my role as the Head of Analysis for the Cabinet Office’s Equality Hub I am in the privileged position of leading the team that analyses disparities in outcomes between different ethnic groups in the UK.

The reasons for disparities between ethnic groups are complex, and include factors such as history, relative levels of deprivation, the different age profile of some ethnic groups as well as many other factors. Despite the complexity of the issues, my team and I do all we can to prevent misuse of the data and help ensure that robust and clearly explained data are furthering the debate on race and ethnicity, which is an emotive topic for many people in this country.

My team’s responsibility for this is firmly rooted in the UN Principle 4 of preventing the misuse of statistics. We do this in a number of ways that align with this principle.

One way we do this is through bringing several analyses together to paint a broad-based picture of a topic of interest. For example, when supporting the Minister of State for Equalities on her reports on progress to address COVID-19 health inequalities we synthesised a large body of research describing the impact of the pandemic on ethnic minority groups. Much of this work involved my team reconciling and reporting on different sources and drawing robust conclusions from different analyses that didn’t always entirely agree.

A second way we try to prevent misuse of data is through the clear presentation of statistics, an example being Ethnicity facts and figures. This website was launched in October 2017 and since then it has been a vital resource to inform the debate about ethnicity in the UK. It gathers together government data about the different experiences of the UK’s ethnic groups and is built around well-established principles, standards and practices for working with data like the Code of Practice for Statistics.

We try to make the content on the website clear and meaningful for people who are not experts in statistics and data. It also contains detailed background information about how each item of data was collected and analysed to help those users with more interest or expertise in statistics draw appropriate conclusions.

The Commission on Race and Ethnic Disparities report recommended that RDU lead work to further improve both the understanding of ethnicity data and the responsible reporting of it (and thereby helping to prevent its misuse). As part of this work, we will consult on how to improve the Ethnicity facts and figures website, including whether we increase the amount of analysis on the site to help users better understand disparities between ethnic groups. Some of this might be in a similar vein to Office for National Statistics (ONS) work during the pandemic on ethnic contrasts in deaths involving the COVID-19. This modelling work showed that location, measures of disadvantage, occupation, living arrangements, pre-existing health conditions and vaccination status accounted for a large proportion of the excess rate of death involving COVID-19 in most ethnic minority groups.

Of course, there can be some difficulties with data that might lead to its misuse: datasets can vary greatly in size, consistency and quality. There are many different ways that ethnicity is classified in the datasets on Ethnicity facts and figures, and these classifications can differ widely depending on how and when the data was collected. For example, people might erroneously compare the outcomes for an ethnic group over time thinking it has remained the same whereas in fact it has changed; this might happen if someone is looking at data for the Chinese, Asian or Other groups over a long time period, as the Chinese group was combined into the ‘Other’ ethnic group in the 2001 version of the aggregated ethnic groups, but combined into the Asian group in the 2011 version of the aggregated ethnic groups in England and Wales.

We also try to minimise misuse and misinterpretation by promoting the use of established concepts and methods including information on the quality of ethnicity data. Our quality improvement plan and significant contribution to the ONS implementation plan in response to the Inclusive Data Taskforce set out our ambitions for improving the quality of ethnicity data across government. We will also be taking forward the Commission for Race and Ethnic Disparity’s recommendation that RDU should work with the ONS and the OSR to develop and publish a set of ethnicity data standards to improve the quality of reporting on ethnicity data. We will consult on these standards later this year.

Finally, we raise awareness and knowledge of ethnicity data issues through our ongoing series of published Methods and Quality Reports and blogs. For example, one of these reports described how the overall relative stop and search disparity between black people and white people in England and Wales can be misleading if geographical differences are not taken into account.

We have significant and ambitious programmes of analysis and data quality work outlined for the future. I would be grateful for any views on how we might further help our users in interpreting ethnicity data and preventing misuse.

Voluntarily Applying the Code

For me there was something exciting, and a bit nerve-wracking, about waiting to see the results of the Code consultation, specifically about ‘voluntary compliance’. It’s a bit like waiting for exam results or the outcome of an interview.

But the consultation responses were great – positive, constructive, and in places quite challenging. Respondents identified the potential advantages of voluntarily adopting the Code – as a means to ensure and improve quality and to enhance transparency and trust in their statistics. While the core target audience for the Code are organisations producing official statistics, there was widespread agreement that the three pillars of the Code – Trustworthiness, Quality, and Value – and the principles are transferrable to other organisations.

At the same time it was noted that some of the detailed practices of the Code (such as about the role of statistical Heads of Profession) are civil service constructs. I conclude from this that organisations interested in voluntary adoption and in applying the Code should, as the consultation document suggested, focus on the pillars and principles, and refer to the practices primarily to help interpret the principles in their own contexts.

But two sets of concerns were identified:


  • To what extent might organisations outside the public sector – which might have different drivers, such as profit making or lobbying – wish to voluntarily adopt the Code? I see this as a question for those organisations – we are, after all, talking about something voluntary. If an organisation sees advantage in aligning its work with the Code, then we would encourage them to do so.
  • What would be the Authority’s role in checking that an organisation voluntarily applying the Code is in fact compliant, to avoid the risk that statistics (and the Code) are brought into disrepute? I’m very clear that the Authority’s regulatory role is defined (in law) quite tightly – we are not in a position to ‘police’ voluntary application in the way we actively monitor the extent of compliance of official statistics, through the Assessment function. But there is an opportunity for the Authority to provide guidance on the Code, to support those interested in its voluntary adoption. For example, we’re planning to share some case studies online early next year.

I noted above that one of the main advantages of applying the Code principles is about enhancing trust by being transparent. Transparency requires organisations to make information available. So, the Authority considers that any organisation wishing to say that it voluntarily applies the Code should publish a statement alongside the statistics, setting out the extent to which it complies (and, where appropriate, areas of non-compliance).

Others can review the statement, form their own judgements, and potentially offer challenge. That might be uncomfortable for the organisations in question – but it’s key to continuous improvement. And the very process of opening one’s working practices up to external scrutiny and being seen to respond to feedback is at the heart of building trustworthiness.

There was also some comment in the consultation around the application of the Code by official statistics producer organisations to data and analysis that are not official statistics; for example, when publishing statistical research, management information or forecasts. Just to be clear, for these types of outputs we are also advocating the voluntary adoption of the Code: where an organisation chooses to adopt and apply the Code principles and makes a public statement about how it does so.

Voluntary adoption of the Code: where an organisation chooses to adopt and apply the Code principles and makes a public statement about how it does so.

We are working on a guide to this voluntary adoption and application of the Code which we will make available through our website. It will be interactive and supported by examples that illustrate how organisations are applying the Code.

Happy Families?

More than the sum of the parts: the role of families of statistics in supporting insight and innovation

In last year’s Code of Practice stocktake, we outlined the idea of ‘families’ of statistics. In this blog, I want to bring out some of the ways that ‘families’ support the way we are thinking about statistics as an essential public asset.

What do we mean by families of statistics?

The traditional way of publishing statistics reflects the way that the underlying data are collected – with each source being published as soon as the statistics are deemed ready. This gets new information into the public domain quickly, supporting decision makers and democratic debate.

But it can lead to the piecemeal release of statistics, a deluge of information that can be hard to interpret coherently. It can make it hard for the user to take a step back and ask “what is this new information telling me?”

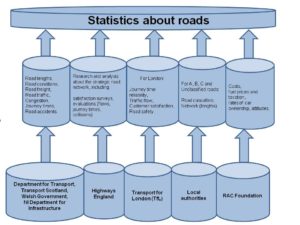
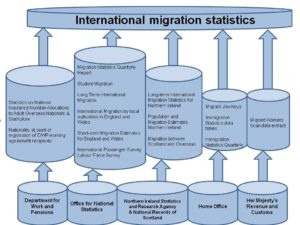
Let me illustrate what we mean by ‘families’ of statistics through two examples – international migration, and roads.

As the diagram below shows, statistics about different aspects of international migration are drawn from a range of surveys and administrative sources and produced by several organisations across the UK. Each set of statistics is useful in its own right but the value of this ‘family’ is maximised when the statistics are brought together so that they shed light on the questions that are important to society. Indeed, ONS does bring several of the statistical sets together, in its Migration Statistics Quarterly Report.

International migration statistical families


And again, many organisations produce statistics, numerical information and research reports and other analytical pieces about different aspects of roads (captured in the diagram below). Some of these include organisations which do not produce official statistics (and who might be interested in voluntary compliance), which reinforces the idea that families are not just about official statistics but about numerical information on a particular topic.


Road statistics families

How do families fit with the refreshed Code?

The draft Code of Practice for Statistics, about which we are currently consulting, is structured around three pillars – Trustworthiness, Quality and Value. Among the principles that support Value are that statistics should be insightful – helping to clearly answer society’s important questions – and that statistical production should be innovative – so that the statistics remain relevant in a changing world.

The idea of families of statistics plays right into this. In terms of insight, approaching the production and presentation of statistics through the strategic lens of a family helps to enable a complete picture of the statistical topic to be provided, and encourages producers of statistics to work collaboratively with producers of related statistics and topic experts (Principle V2, practice 3, draft Code of Practice for Statistics ). And it supports the explanation of the coherence of the statistics with other related data sources and statistics, and signposting to the related statistics (Principle V2, practice 4, draft Code of Practice for Statistics ). In terms of innovation, the family approach helps producers to seek out new partnerships which could improve the value of their statistics (Principle V4, practice 1, draft Code of Practice for Statistics) and to explore the potential of new and existing data sources (Principle V4, practice 2(i), draft Code of Practice for Statistics).

What will OSR do about families?

For us, the family approach will support the way we are increasingly looking at issues systemically: reviewing and reporting on issues and opportunities that cut across the statistical system. As part of our increasing focus on themes, as described in our Business Plan, we will work with statistical Heads of Profession (HOPs) across government to support their development of families of statistics in the areas for which they are responsible, working with users of the statistics.

What should statistical producers do next?

I mentioned above that we will work with statistical HOPs across government to support their development of families of statistics. In preparation for this it would be really helpful if they could:

  1. Start to think about how, in practical terms, families could benefit them and improve TQV in their outputs, and how they might start to use families in their statistical planning, and their production and dissemination work. This might be a helpful starting point for discussion:

trustworthy

  • leadership and coordination across the system, including in those cases where organisations’ responsibilities relate only to part of the statistical value chain, such as NHS Digital which specialises in ‘data’.
  • taking account of needs of wide range of decision-makers not just Government
  • orderly release

quality

  • fully exploiting administrative data from various sources
  • clarifying responsibility for fixing data problems
  • standards for management information

value

  • easier access to statistics  e.g. for researchers
  • protecting insight – complement latest snapshot data


  1. Consider how broadly to define families. What level of granularity is most appropriate?

Any questions?

If you have any questions about families of statistic or would like an accessible version of the diagrams, please contact me on regulation@statistics.gov.uk

More generally, the values of OSR include being: externally engaged and connected; enquiring and open-minded; and inclusive and listening to others – we want to listen and learn. So, if this blog stimulates any other thoughts, please let me know.


Breakfast in the Boardroom

Reflections on the Code and the wider analytical community

Kimberly Cullen, Statistics Assessor


It was the bacon roll that did it. Ed, our DG, had just asked if I wanted to attend a breakfast meeting with several Directors of Analysis from across government to discuss the refreshed Code of Practice for Statistics. I hesitated – was thinking about my deadlines when I heard one of the most beautiful sentences in the English language: There will be bacon rolls.

Want me involved? Bring. Food. It really is that simple.

So bacon rolls aside (they were divine), how was the meeting? Fortunately there was a positive response to the Code changes (always a good start to a meeting). And, crucially, there was agreement that the revised document presents an opportunity to raise awareness across analytical communities. This was great news ­­– but what is this opportunity and how do we at OSR frame it and then use it?

We all know there’s not just official statistics that are produced in government departments but administrative data, management information, research, financial data, secondary analysis, and modelling to name a few types of numerical information. Often these are not published nor end up as official statistics but nonetheless play a significant role in policy and decision making particularly in Ministerial government departments. I often hear throughout the Code seminars of the urgent and unyielding demands to provide information which are not official statistics and yet required to inform policies and decisions. Those working in this environment ask us repeatedly, how does the Code assist in this ambiguous space? How do those in the non-official stats analytical community use the principles and practices? I wish a bacon roll could turn their frowns upside down but sadly food is not the answer in this respect (I know, I can’t believe it either. . . ).

The draft Code contains helpful principles for wider analysis but the feedback suggested that we need to be clearer that the Code relates to the publication of such material (whether secondary analysis, modelling, etc.). And that what is published should be equally accessible to all. Both excellent points and it occurred to me that I had always just assumed – because I work with the Code daily – that everyone understood that. Right. We need to work on our messaging.


“What is published should be equally accessible to all.”


Use of the Code does not mean an obligation to publish all analysis and data in departments – only what ends up as official statistics. The message to the analytical community is that the Code principles of trustworthiness, quality and value (TQV) can apply to all numerical information. The Code has the potential to enhance public confidence in wider numerical information. TQV underpins official statistics but are universal properties to which all of us that work with information and data aspire towards. The Code can be a helpful guide to those collecting, analysing, and disseminating any type of numerical information. We need to get that message out.

Based on comments from the breakfast, we also realised the need to highlight the synergy between related guidance, such as standards applied in other professional groups (e.g. actuaries) and those using the Aqua Book for producing quality analysis. The Code is a tool to support numerical analysis and our principles do not supersede the expected standards in other related professions and industries.

Many thanks to the senior leaders that came to the meeting and provided such excellent feedback on the Code. As a result, we now recognise there is a spectrum of regulatory and advocacy activities that we are working within. We are regulators of the Code when assessing official statistics and we advocate the Code with the rest of the analytical community. How far down the advocacy route we go depends upon the audience and type of data but that requires further development which we have started.

We are keen to show the wider benefits of the Code principles and practices and support all those in the analytical community through a two-pronged approach of regulation and advocacy. It’s a rather exciting time in the office. Watch this space. . .

Richard Laux: Benefits from voluntary compliance

Richard Laux, Deputy Head of Regulation


In our consultation launch document, we floated the idea that a wide range of organisations might wish to comply with the Code of Practice for Statistics on a purely voluntary basis. We are keen to hear others’ views on this approach; in this blog I want to explain some aspects of our emerging thinking, to help stimulate debate.


Who might ‘voluntarily comply’?

By law the Code applies to a range of organisations, almost all from the public sector, which are ‘producers of official statistics’. In effect these organisations must ‘statutorily comply’ with the Code.

But many other organisations in the third sector, in academia, in local government, and in the commercial sector produce numerical information which are valuable to society – that is, the information has the potential to enhance debate and support informed decision-making. For example, local authorities publish performance information such as how much household waste is recycled and the percentage of council tax they collect. Companies publish information like their charitable donations and their carbon footprint. And universities which publish information about the employability of their students, their success in widening participation access, and their funding and spending. All of this information has public value: they provide insight, generate understanding and help people answer key questions.


What does ‘voluntary compliance’ entail?

We don’t think that a one-size-fits-all approach to voluntary compliance is the best way forward, and we would naturally support innovative approaches. But at the same time, we think it is likely that there will be some common approaches across organisations that are interested. For example, it seems sensible for an organisation to review its own policies and procedures against the principles of the Code, and to document its findings, including any parts of the Code that it does not fully comply with.

The organisation should focus on describing how it secures the three pillars of the Code – Trustworthiness, Quality and Value (TQV) – which are universal, and draw on the principles in the Code to guide its judgement. Where it is unsure how to demonstrate its approach to TQV, it might make sense to look at the detailed practices as a prompt or guide – although we believe that voluntary compliance will work best when targeted at the level of principles rather than practices. And it seems sensible for an organisation that considers that it is voluntarily compliant to say so on its website; if it considers that it is partly compliant, it seems sensible to explain its thinking together with any plans it has to enhance the extent of its voluntary compliance. We are happy to provide advice about the Code, to help organisations understand their own compliance.

Organisations in the commercial sector might not immediately recognise the relevance of the concept of public value to their work. But we would encourage them to think broadly – for example, in many cases the information they publish helps to make markets work efficiently, inform shareholders, and helps customers make decisions. These are all ways of providing public value.


What are the benefits?

From the perspective of the organisation, voluntarily compliance offers the opportunity to:

  • compare existing practices against the high standards required to enhance public confidence in its data and statistics;
  • draw attention to its high standards of statistical activity;
  • demonstrate an aspirational commitment to trustworthiness, quality and public value.

The impact of doing so is likely to vary between organisations – but is likely to include better numerical information, greater confidence in the use of that information, and competitive advantage. In some areas, we know that official statistics draw upon the numerical information produced by these organisations, and so documented voluntary compliance provides a degree of assurance about the trustworthiness of the organisation and the quality of the source.


What will the OSR’s role be?

We are happy to provide advice and guidance about the Code and, where possible, attend workshops to help the organisation; we might also be able to put organisations in similar sectors in touch with each other, to develop networks. And we will consider whether there are ways of presenting the Code that make it more accessible to organisations with an interest in voluntary compliance. Although it would not be possible to designate organisations’ statistical products as National Statistics, there may be scope for us to look at the quality of the statistics, if we were invited to do so.


Any questions?

If you have any questions about voluntary compliance, please contact me on regulation@statistics.gov.uk

More generally, the values of OSR include being: externally engaged and connected; enquiring and open-minded; and inclusive and listening to others – we want to listen and learn. So, if this blog stimulates any other thoughts, please let me know.