Northern Ireland Statistics and Research Agency’s Population Statistics
Quality assurance of administrative data standard has three levels of assurance: basic, enhanced and comprehensive.
This case example illustrates basic and enhanced quality assurance across the range of administrative data and other sources with complex data flows, to derive population statistics produced by the Northern Ireland Statistics and Research Agency (NISRA).
It demonstrates an effective approach to managing the assurance of data provided by a group of suppliers including other statistical producers.
Contents:
Background to the statistics
The data sources and suppliers
Approach to the quality assurance of the admin data
Outline of the NISRA’s quality assurance approach
- Close liaison with data suppliers in other bodies as well as within NISRA
- Determine data collection and QA arrangements used by supplier partners, to identify limitations in relation to use
- Regular contact with other population statistics producers to share insight about quality issues and method developments
- Determine nature and extent of QA checks required on received data sets prior to production of statistics
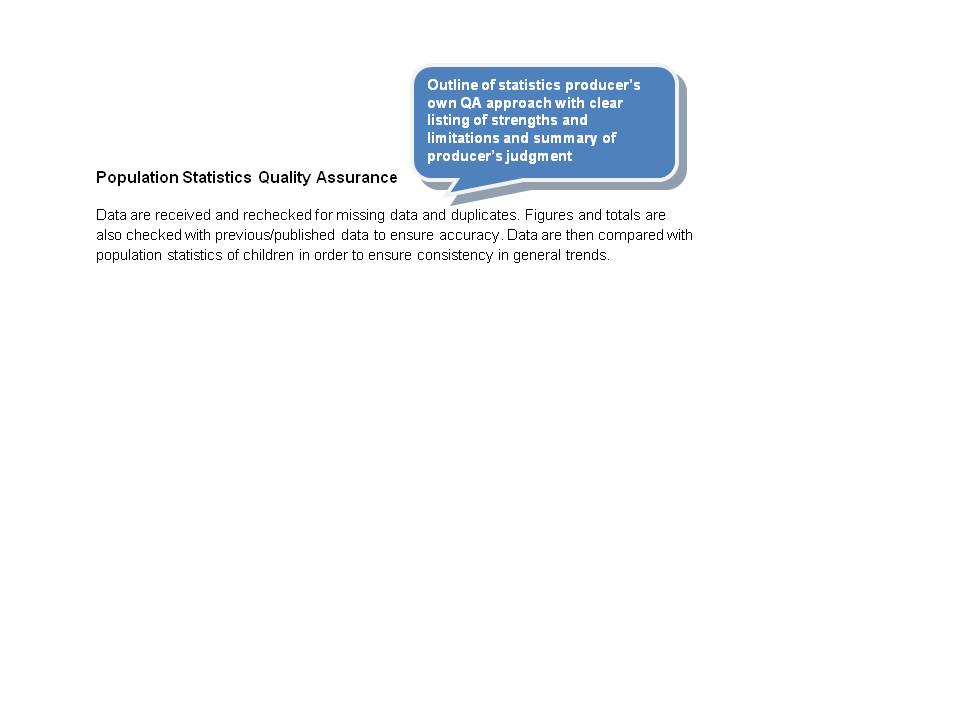
- Conduct own QA eg. validating imputation, verification against other data sources, consistency and sense checks
Background to the statistics
Population statistics are an essential part of the Northern Ireland’s statistics infrastructure. They describe the size and structure of its population, illuminate how and why the population is changing, and project how it might change in the future. The statistics play a vital part in planning and inform decision making from national to local level and are a building block in the development of a large number of economic and social statistics.
Population statistics are used by a range of users to understand what the population of Northern Ireland looks like as a whole and at local level, to feed into the development of wider economic and social statistics and to inform decision-making. Population estimates are widely used within central government, as well as being used by local authorities and health bodies, other public bodies, commercial companies and individuals in the private and academic sector:
- the UK government uses population statistics to allocate public funds to the Northern Ireland Executive
- the Northern Ireland Executive and government departments use population estimates and projections to plan services and resources including for health, housing and education
- more generally, the statistics are used to calculate rates (as the denominator), and to weight survey data in order to estimate results for the whole population
- these statistics are also of interest to those involved in research & academia
- commercial organisations use these statistics for strategic planning, evaluation and project review
Excerpt from NISRA population statistics infographic
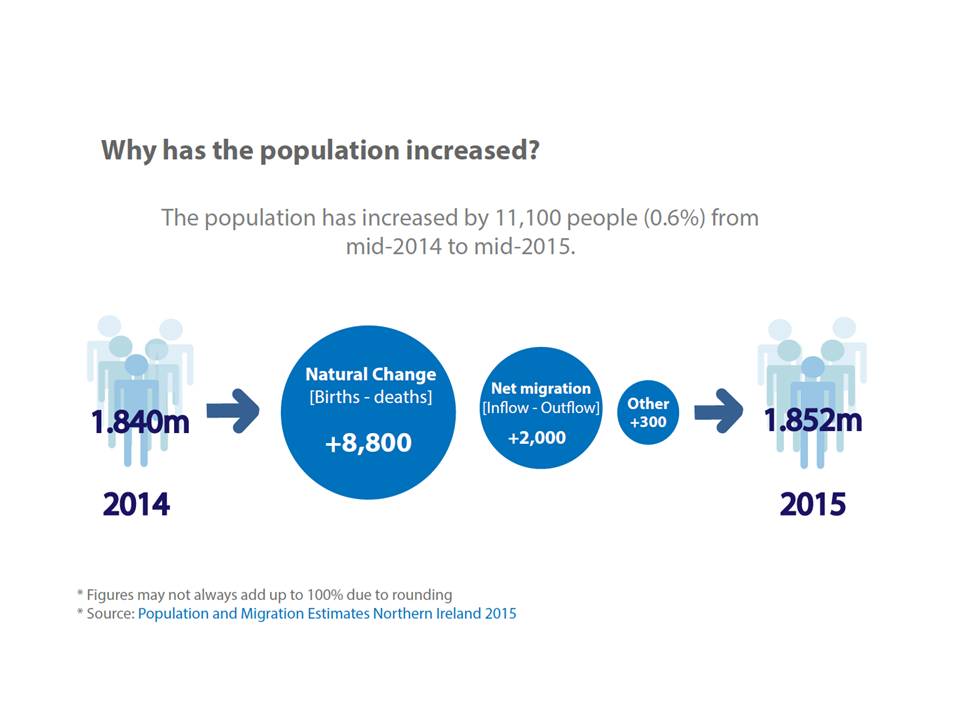
Source: NISRA Population and Migration Estimates 2015
The producers
NISRA produces a range of statistics on population and projections. Population and migration estimates, Northern Ireland is published annually and presents statistics on the population of Northern Ireland as a whole and for local government districts, Parliamentary constituencies and super output areas within Northern Ireland.
Northern Ireland’s population statistics are based on the latest census data for and take account of the population changes since the census using data from administrative sources covering the components of population change – births, deaths and migration.
The report presents statistics on the population of Northern Ireland by age and sex, as well as statistics on the components of change. It also includes historical information and population densities. NISRA publishes supplementary tables for various other sub-national areas including health districts, former local government districts, education and library boards, electoral wards and neighbourhood renewal areas.
The data sources and suppliers
Population estimates for Northern Ireland draw on data that are processed by NISRA, as well as directly from primary data sources. The primary source data – including those processed by NISRA – are drawn from administrative systems and the Northern Ireland population census. Office for National Statistics (ONS) produces national population projections for the UK and each of the constituent countries including Northern Ireland. NISRA produces sub-national projections for Northern Ireland.
The primary source data and processed data flow between different teams in NISRA, and between NISRA and ONS. The statistics team that produces the population estimates and projections also produces estimates of migration. NISRA, ONS and NRS share data between them on cross-border migration flows.
NISRA supplies the Northern Ireland mid-year estimates and estimates of older people for Northern Ireland to ONS. ONS combines these with its own estimates for England and Wales and similar estimates from Scotland to produce mid-year estimates and estimates of the number of older people across the UK.
ONS produces population projections for the UK and all the constituent countries within the UK using data from the various mid-year population estimates. NISRA publishes a report on the national population projections for Northern Ireland using data supplied by ONS, and produces population projections for areas within Northern Ireland.
This figure shows a diagram of the data sources, processing and data flows for the production of population estimates and projections for Northern Ireland:
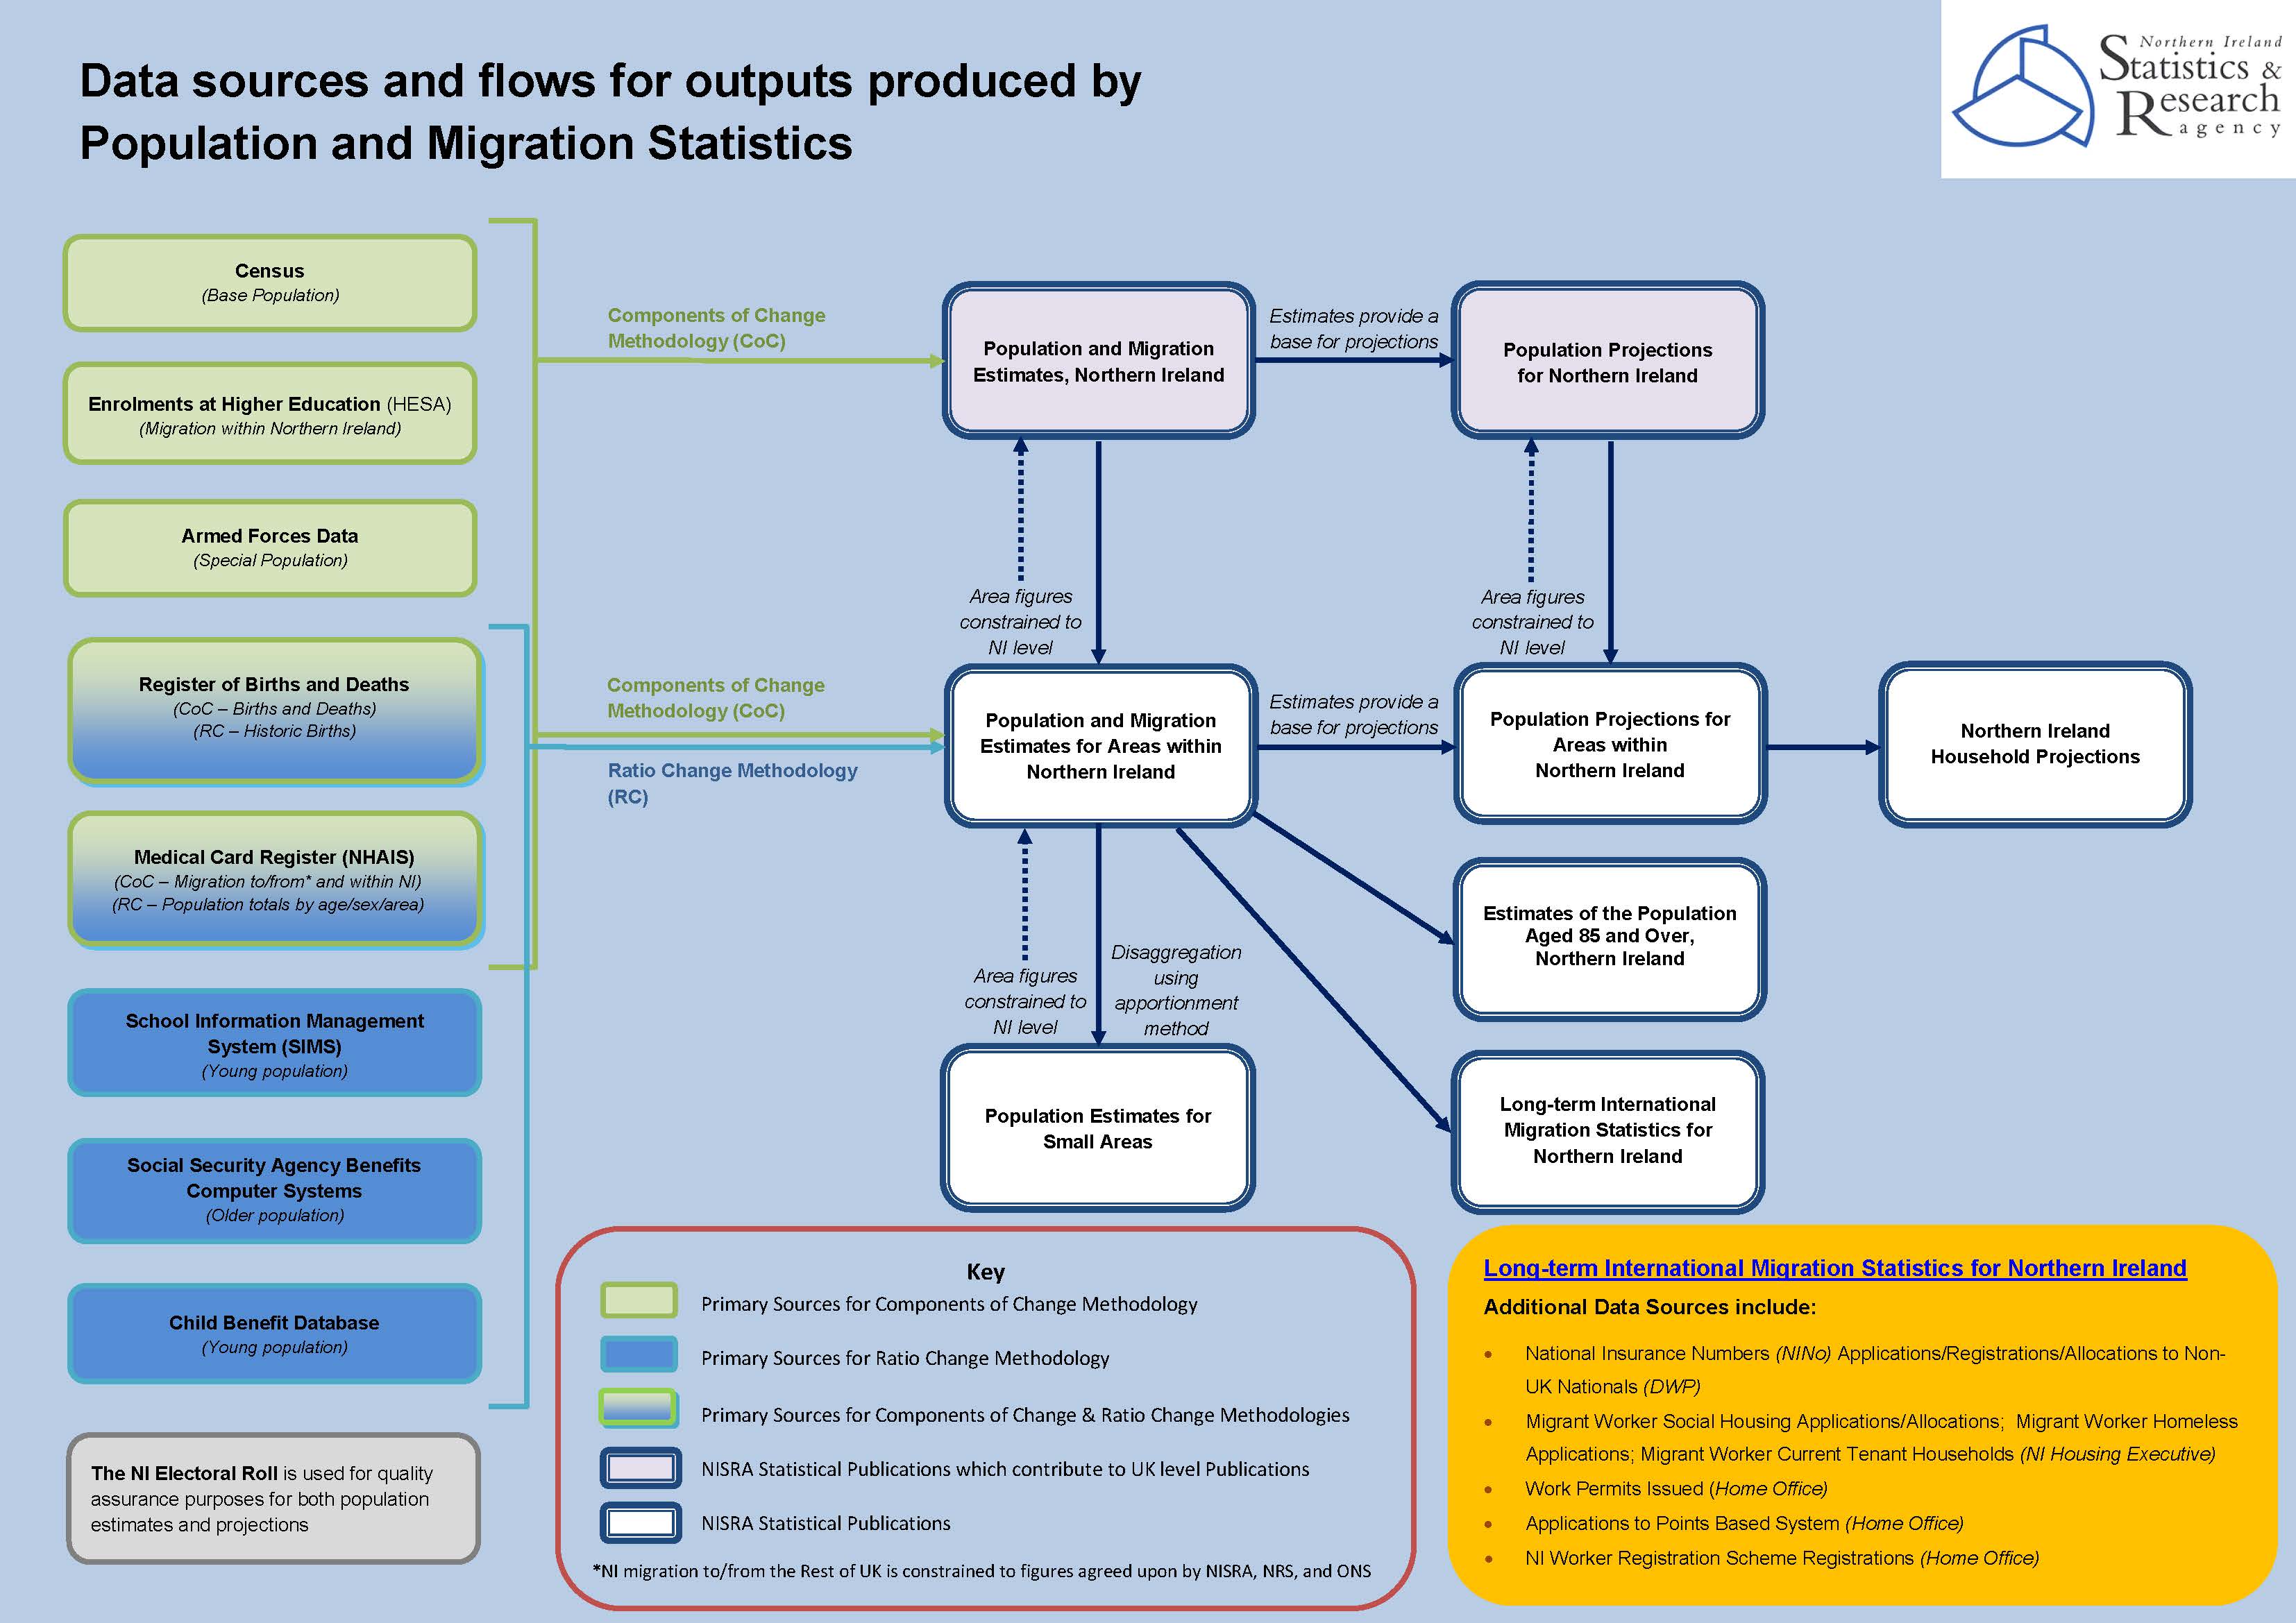
Source: NISRA, Administrative Data Sources Data Flow Diagram
Approach to the quality assurance of the admin data
NISRA has compiled a holistic view of the assurance of the data sources used to produce its population estimates and projections statistics. While in the main these are admin data sources, it also includes 2011 Census data.
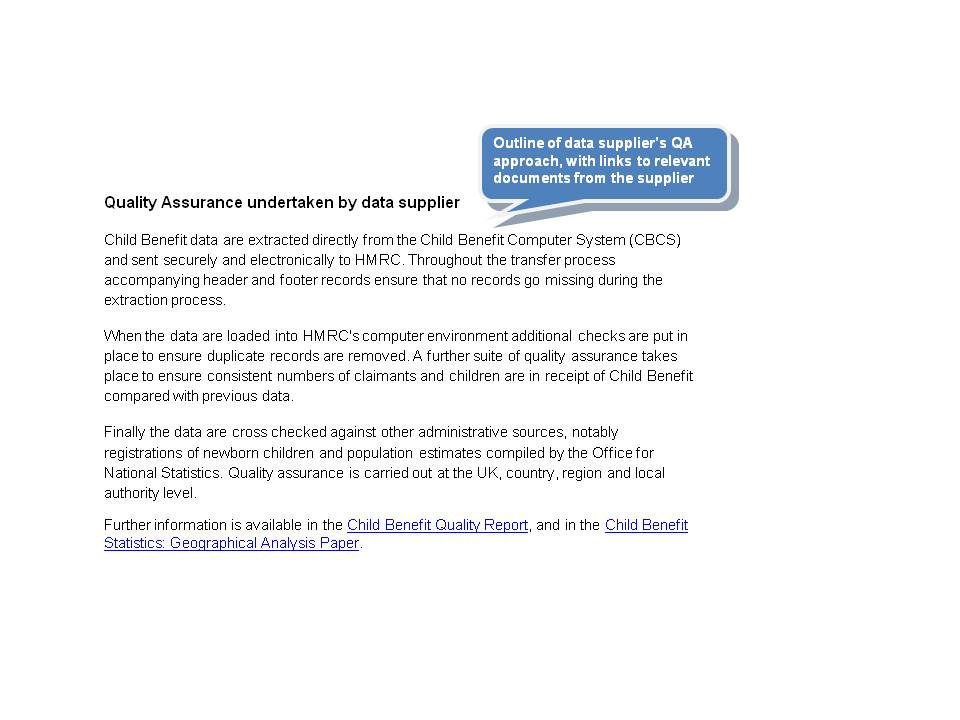
It provides a clear explanation for each of the QAAD practice areas: operational context and admin data collection; communication with data supply partners; QA undertaken by suppliers; and the producers’ QA.
It also explains the basis for its judgment about the level of assurance undertaken. Each QA description has a summary of the strengths and limitations of the data source with respect to use in producing population statistics and a clear statement about why NISRA has confidence in the data.
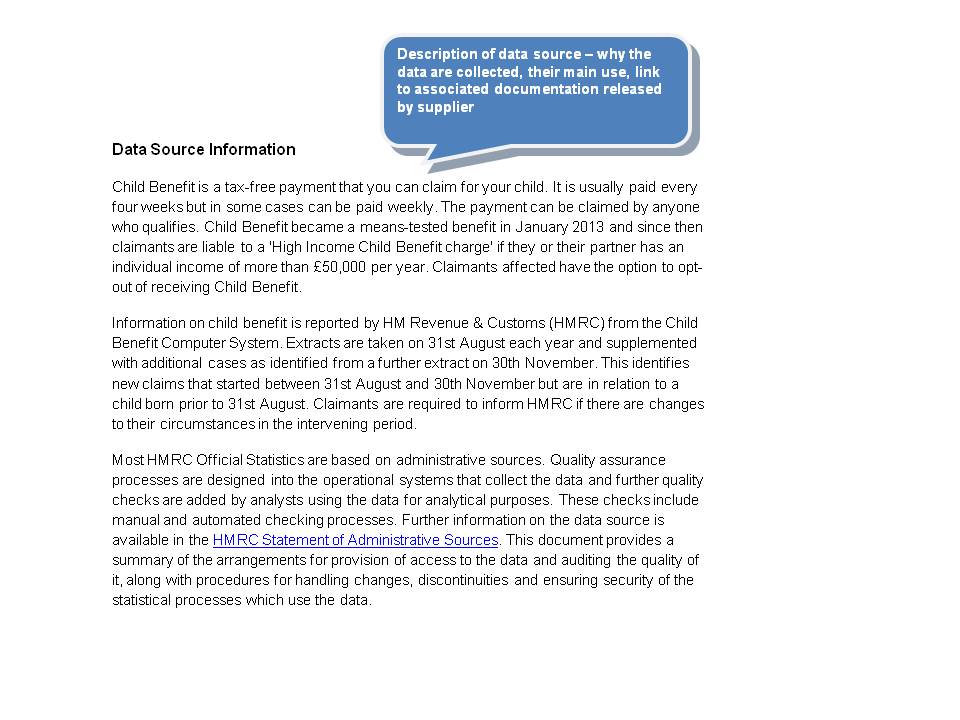
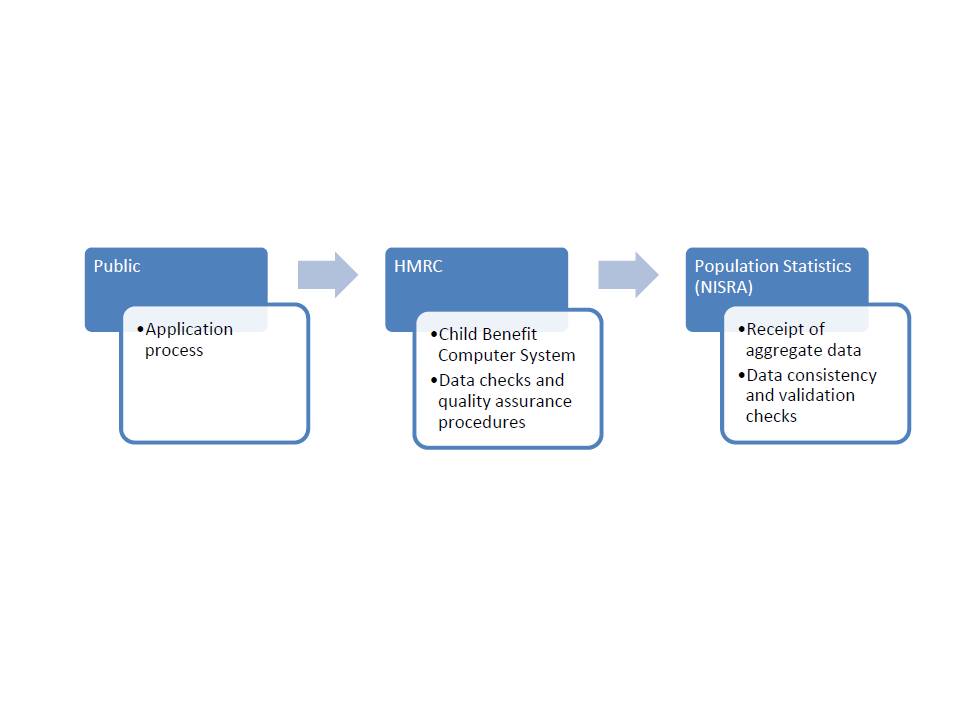
For example, it identified the level of assurance for the Child Benefit Database as ‘basic’. There are known deficiencies in these data (eg partial coverage of 16 to 18 year olds). However, the overall risk of data quality concerns is considered to be low, since the data contributes to a sub-set of the population and has tight quality assurance measures during data collection.
Example QA description taken from Population Estimates and Projections Data Quality Document:

Strengths/Weaknesses of Data Source
| Strengths | Weaknesses |
|---|---|
|
|
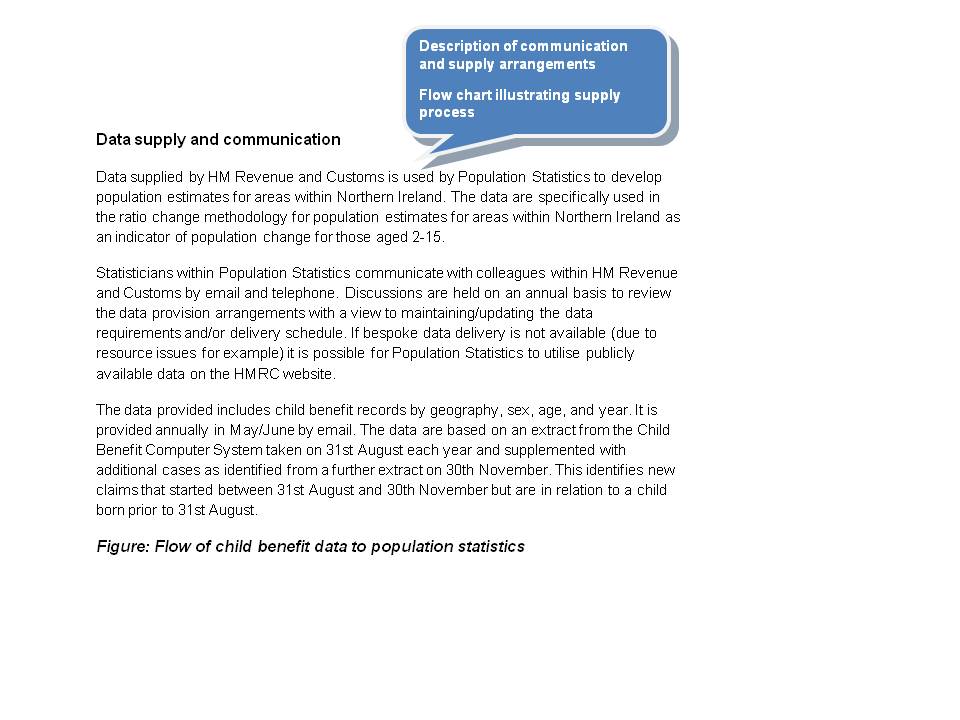
Since the child benefit data are specifically used in the ratio change methodology for population estimates for areas within Northern Ireland as an indicator of population change for those aged 2-15, the risk of quality impacts on the overall estimates is considered to be low.