Findings
Introduction
1.1. Statistics about butterflies are important not only in understanding changing trends in the butterfly population. Butterflies are considered to give a good indication of the broader state of the environment as they respond quickly to changes in climate and habitat and are considered representative of other insect groups.
1.2 Understanding change, and particularly threats, to our environment is essential. The changes we see in nature and our environment will have potential impacts on the country’s economy, on our society and on people’s wellbeing. As such, statistics about butterflies are fundamental and are valued by a range of users across policy areas, academia, and research.
1.3 Statistics about butterflies are a significant contributor to a wider set of biodiversity indicators. In January 2023, the UK Government launched its Environment Implementation Plan which set outs its goal to ‘… halt the decline in our biodiversity so we can achieve thriving plants and wildlife’. The plan is an update on to the 25 Year Environment Plan.
1.4 The UK Government has also published its Outcome Indicator Framework for the 25 Year Environment Plan. This framework contains 66 indicators, several of which relate to measuring the relative abundance and distribution of wildlife species. While reporting against these indicators is still being developed, use of data on butterflies has been identified as integral in understanding changing trends in the environment. Measuring and monitoring biodiversity in England will help to understand progress against such targets and help understand the impact of interventions and new initiatives to improve the environment at national and local levels.
1.5 The wider set of biodiversity indicators is undergoing review at the time of assessment and some welcome developments are likely to come from this which would be relevant to the development of the statistics.
1.6 The statistics we are assessing present an overall measure of the butterfly population across time as well as similar measures for habitat specialist butterflies (species strongly associated with semi-natural habitats such as chalk downland) and butterflies of the wider countryside (found in both semi-natural habitats and the wider countryside).
1.7 Defra produces these overall measures for England and the UK. Users can access species-level data, available for the UK as a whole and for individual nations of the UK, through the UK Butterfly Monitoring Scheme website. NatureScot produces statistics for Scotland in a similar manner as Defra does for England.
Data collection and Citizen Science
1.8 Both sets of statistics are based entirely on data drawn from the UK Butterfly Monitoring Scheme (UKBMS). The UKBMS was launched in 2006 and was formed from older surveys that have been run since the 1970s. The monitoring scheme is funded and organised by Butterfly Conservation, the Joint Nature Conservation Committee (JNCC), the British Trust for Ornithology (BTO) and the UK Centre for Ecology and Hydrology (UKCEH).
1.9 The UKBMS is an excellent example of citizen science where a large and detailed data set is gathered by volunteers. Citizen science is often used to aid conservation research and the scheme attracts interest from amateur enthusiasts and others who receive guidance and support on data collection and recording. Once collected, experts from the relevant organisations undertake verification and review of the data. This is quite a different way for interested individuals to engage with the data and reflects how a wider range of stakeholders values and recognises the importance of statistics on this topic.
1.10 The team has strong links with the organisations in charge of data collection and the survey itself is carried out by a large number of trained volunteers. This means that a key biodiversity measure is based on a much larger and more-varied sample than might be the case for a more conventional survey.
Survey and methods
1.11 Through the UKBMS, data are collected from around 3,000 sample locations from a total list of around 6,000 by around 3,000 skilled volunteers each year. The scheme comprises three survey components:
- a) Traditional butterfly transects[1] (Pollard Walks);
- b) Wider Countryside Butterfly Survey;
- c) Targeted surveys in which non-transect methods are used to survey specific priority species.
1.12 The sampling locations of traditional butterfly transects and targeted single species surveys are chosen either by the recorder, a local transect co-ordinator or a project officer from a local conservation body, who also choose the exact route to be followed. The same sites are sampled on a yearly basis, though for timed counts the location of the route may change according to changes in the species distribution. Traditional transects are surveyed, where possible, on a weekly basis throughout the active butterfly flight period and the wider countryside butterfly sites are surveyed twice in the same period. Particular weeks may be missed due to weather or volunteer availability. Data are primarily recorded through online systems, which records site details (for example location and habitat information), the butterfly counts, and weather and other visit details from each survey. Volunteers are well supported and receive training and guidance on collecting and submitting data by Butterfly Conservation.
1.13 Once collected, automated and manual checks by volunteer experts are applied to records submitted by volunteer surveyors. Additional end-of-season checks are also carried out by Butterfly Conservation and the UK Centre for Ecology and Hydrology with some records excluded from analysis. Many of these checks take account of known flight ranges, distributions and behaviours of species as well as the weather at the time of surveying. The quality assurance checks described seem comprehensive and take into consideration the known behaviours and ranges of individual species.
1.14 The data are then standardised to conform with the UK Butterfly Monitoring Scheme database structure, including standardised species nomenclature and data integrity checks on date, time, and accurate geographic location time information.
1.15 Variables are then calculated for each species of butterfly including the various indices reported in the statistical publication. The methods used are described in the technical annex published by Defra alongside the statistical releases. For example, the approach used to arrive at the combined species trends is documented, citing peer reviewed papers where relevant, as well as some of the complexities and issues that must be considered.
1.16 The technical annex is clear about some elements of the methodology, for example statistical techniques are clearly named and academic papers referenced. However, while some of the issues that can affect the method are described, the nature of each effect and how this might affect use is not as clearly discussed.
1.17 The Butterfly Conservation site includes a large amount of additional information about the UKBMS. This includes information about where surveys are carried out as well as where less data are gathered. There is further information on the quality assurance approach used to assess submitted records as well as blogs discussing the nature of citizen science in terms of both its importance and how results can be quality assured.
1.18 Survey methods are described in the statistical bulletin and in the accompanying technical annex, with users also signposted to the UKBMS website for more details. While this information is available for users, there is little discussion of the strengths and limitations of the survey approach, for example the bias towards particular areas for surveying. None of the users interviewed as part of this assessment raised any concerns about the spatial distribution of the samples but it is nonetheless important contextual information.
1.19 Additionally, Defra publishes no information about how changes in the level of surveying may affect survey results. There is reference within the technical annex to methods requiring good coverage throughout the butterfly season but no information on whether this is met or how the techniques to produce the statistics take account of the differing levels of spatial coverage across the country, nor how these issues affect the statistics and their interpretation. Differing levels of surveying individual species and differing quality issues for those more difficult to survey (for example canopy-based species) might also affect estimates. Information presented in the Defra publications on how these surveying issues might affect the combined trends is limited.
1.20 The information available on the Butterfly Conservation site has been designed to support Butterfly Conservation’s own outputs which focus on individual species, rather than the national or habitat trends presented in the Defra publications. Since Defra is publishing these statistics under its own banner, it is essential that Defra understands the methods used to produce the statistics, the impact of those methods on the statistics, in particular regarding uncertainty, and documents this clearly. While it is reasonable to provide links to supporting documentation the Defra team needs to ensure users can easily find relevant information. Where these external documents are relied upon it should be transparent what specific elements of the document are relevant and how it relates to the figures presented in the Defra publication.
[1] A transect is a route that cuts through a natural landscape so that standardized observations and measurements can be made.
Requirement 1:
To help users understand the context and strengths and limitations of the statistics, Defra should expand on the information it provides to its users about the methods used to create the statistics, the reasons for those choices, how limitations like the representativeness or spatial bias of the survey are accounted for and what uncertainties in the statistics arise as a result. This should include information on level of surveying, spatial bias, and any species-specific challenges in surveys. Spatial metadata on the survey could be accessibly provided using maps or heat maps or simply via text description that should allow users to assess how representative the latest year’s sample is and compare representativity over time. It would provide helpful reassurances to users for methods and decisions that align with a standard approach used internationally or in academia to be flagged.
Presentation of long-term trends
1.21 Some users raised concerns about the varying and fixed starting years for Defra’s presentation of the long-term trends. It is unclear from the documentation why Defra selected 1976 as the baseline nor why it considers this appropriate particularly given that elsewhere Defra uses 1990 as the base for long-term trend analysis.
Figure 1: Trends for the abundance of all species of butterflies resident in the UK, 1976 to 2021
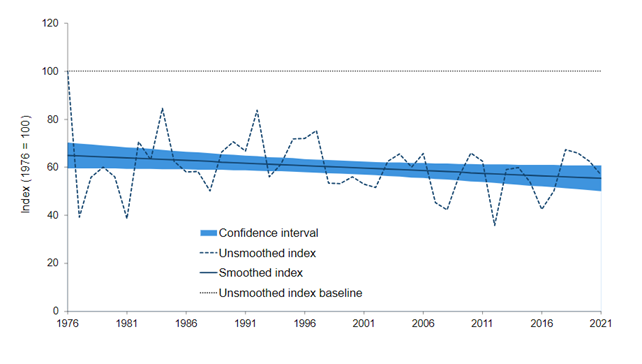
This chart shows the smoothed and unsmoothed index values from 1976 to 2021. It shows a peak of 100 for 1976 and fluctuating values between 40 and 80 since then. It also shows a slight downward trend over that period, along with margins of error. You can see the full data for this chart here.
Source: Butterflies in the United Kingdom: habitat specialists and species of the wider countryside, 1976 to 2021 [Figure 9.1]
1.22 1976 was the first year of the UKBMS and coincided with a particularly hot and dry summer. In particular it is not clear whether the high value shown for 1976 was typical of the (unknown) values for previous years, or an outlier. It would appear to be a high and unusual baseline year that poses some substantial presentational issues that may affect the interpretation of the statistics. This is especially the case given some users may look only at the key findings and summary sections where this atypical year is not mentioned. In this case it may give the misleading impression that there has been a continuous decline since 1976 rather than a sudden drop followed by a levelling off, or that 1976 was an unusual year in an otherwise fairly level trend.
1.23 In discussions as part of this assessment the statistical team at Defra did indicate that both the starting point and the possibility of adding additional trends were issues that it is starting to consider.
Requirement 2:
To help users understand how the statistics can be used, Defra should provide appropriate and accessible information about long-term trends for butterflies, including consideration of where alternative trends might be considered and why a particular definition was appropriate.
Development Plans
1.24 Defra is reviewing the methods used within many of the biodiversity statistics and some of the alternative methods have been explored for the butterflies statistics. This includes considering how useful varying the starting years for long term trends is, as well as the method used for creating combined trends. While it is positive that the team is continuously reviewing the approach taken to producing the statistics, this is not made clear within the publication itself.
1.25 Publishing details about possible planned developments and the timeline associated with these can help inform users of how the statistics might develop. This allows them to feedback on how this may impact, positively or negatively, their use of the statistics and may lead to further developments or refinement of currently planned developments.#
Requirement 3:
Defra should publish its development plans and the outcomes of the review of user queries should be published alongside the statistics. Users should be made aware of any possible changes to the statistics and be given the opportunity to feed in their views.
Stakeholder engagement
1.26 The Defra team responsible for publishing the statistics has a good longstanding relationship with Butterfly Conservation and the team maintains regular contact on the data and survey methods employed. Butterfly Conservation works directly with many of the wider user groups and feedback on the statistics tends to be gathered through this engagement route. Since data collection is via a citizen science approach, the Defra team should consider whether this provides a means to engage with a wide range of interested members of the public. For example, awareness of the statistics and how to engage with the team could be mentioned in the training materials provided to surveyors.
1.27 The statistics team has a good understanding of how the statistics are used within Defra. This is enabled by many of the main users sitting within the wider biodiversity or indicator teams. The Defra users we spoke to recognise the importance of these statistics and considered the team working on the statistics as helpful and informed.
1.28 Users of the statistics are given contact details for the team which appear prominently at the start of the statistical bulletin. The Defra team also encourage users to complete a snap survey on their data requirements. However no formal strategy for widening user engagement or engaging with known and unknown users is currently in place.
1.29 The wider suite of biodiversity statistics is undergoing an internal review by the biodiversity indicators team and user engagement is being examined, with a new engagement strategy being developed. The butterflies team recognises the opportunity offered by this review and the new engagement strategy and plans to utilise this to help them better understand user’s needs.
Requirement 4:
To enhance the public value of these statistics, Defra should develop a strategy for user engagement in relation to its two sets of butterfly statistics. Where appropriate this should build on the wider strategy relating to biodiversity indicators to ensure a coherent approach to user engagement and optimise the resources devoted to engagement.
Related Links:
Current and future assessments
Back to top