Public Value
Value means that the statistics and other numerical information are accessible, remain relevant and benefit society; helping the public to understand important issues and answer key questions.
Value is a product of the interface between the statistics or other numerical information and those who use them as a basis for forming judgements.
Back to topFindings
Insights about the UK Productivity Puzzle(s)
One of the reasons for our assessment of these statistics is to look at the extent to which the data help answer important questions about the productivity puzzle or puzzles. We found from our engagement with users and our desk research that there is much debate about the nature of the productivity puzzle(s). Some users reflected that ONS adheres to the view that productivity is a supply-side concept and that demand-side factors are indirect and second order. ONS also focuses on the slowdown in productivity following the financial crisis whereas some we spoke to see the puzzle as relating to a much longer-term malaise. A recent survey of UK academic economists tackled the question of which rationales behind the productivity slowdown are the most powerful, without drawing absolute agreement across the profession. The two most important causes for the productivity slowdown amongst the economists surveyed were low-demand (including due to the 2008 Global Financial Crisis, austerity, and Brexit) and labour market factors.
ONS does not accept that there has been bias towards supply-side explanations in its expression of the growth puzzle and stands by its view of the productivity puzzle as weak growth since the 2008 Global Financial Crisis, particularly acute in the UK.
Some users expressed concerns that ONS has framed the puzzle as a growth puzzle primarily focussing on why UK productivity growth rates had not returned to the 2% annual year-on-year growth levels that predated the 2008 Global Financial Crisis (GFC). Figure 1 below was commonly presented by ONS as an illustration of the growth puzzle, depicting the growth gap against a long-term steady 2% linear annual year on year growth. As can be seen from the chart title for Figure 1, ONS frames the growth puzzle as the gap against a continuation beyond the GFC of annual growth of around 2%.
Back to top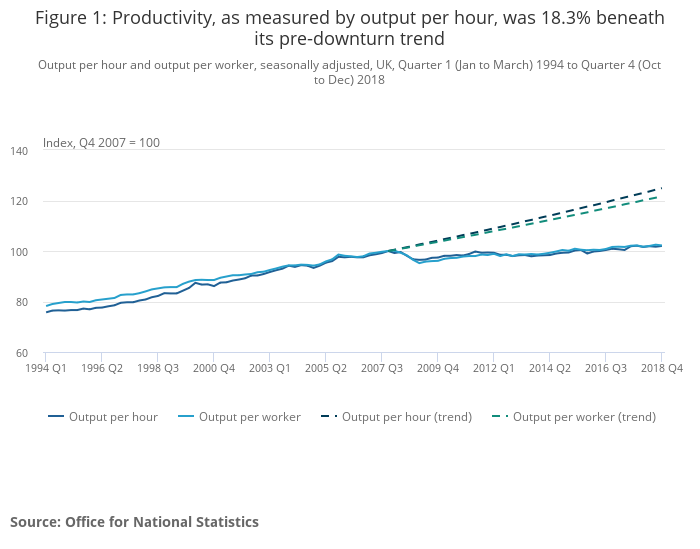 Back to top
Source: ONS – Labour Productivity, UK: October to December 2018. Figure 1.
Back to topThere are alternate assumptions that ONS could have made in projecting productivity trends into the future as shown in Figure 1 which might have offered different interpretations of the period before the financial crash and following the crash. ONS has now changed its presentation of the productivity puzzle and no longer uses the graph in Figure 1. A concern expressed to us has been that the projection of ongoing productivity growth at a rate of 2% per annum was assumed in Government business cases for investment such as transport investment. We checked this and in respect of transport evaluation we are satisfied that more contemporary assumptions about UK productivity growth are being used for evaluation of business cases corresponding to estimates from the OBR.
We found that ONS has been open about the debate and has published widely on the different rationales for the slowdown in productivity. We recognise that it is challenging for ONS to reflect the extent of the debate on the causes of the productivity puzzles within the confines of occasional statistical commentary. ONS is only one body contributing to the effort to understand the drivers of the UK’s productivity puzzles. Debate about the productivity puzzles is moving on due to the pandemic. ONS has carried out and commissioned work to shed light on the nature of the significant turning point in growth in 2008 including:
- work on ‘double deflated’ measures of output and the intended introduction of double-deflated real output measures later in 2021, which we wrote to ONS about in January 2021
- improving the measurement of prices of communications services is being taken forward by the deflators improvement programme
- the movement of economic activity outside the production boundary has been taken forward by ONS Fellow Diane Coyle and others
- the introduction of a Management and Expectations Survey which will help to examine the impact of economic shocks such as the COVID-19 pandemic on the main components of productivity – inputs, outputs and prices
All the areas above may contribute to further understanding the ‘puzzle’; however, it is too early to draw any conclusions that could feed through to ONS’s data. As ONS has limited capability to shed light on understanding the recent economic history in its productivity commentary it will need to find the headroom to provide such insights through its occasional research articles. To produce these, ONS productivity analysts and statisticians need to ensure an appropriate balance between statistical production, the development of the statistics to meet users’ needs and publishing insightful analysis which informs understanding of the impacts of economic shocks on different aspects of the productivity puzzles. ONS productivity analysts are engaging with the new Productivity Institute which has been set up to examine this issue.
Back to topClarity about what is happening to UK productivity
ONS’s recent move to a single productivity bulletin to replace several separate bulletins is a positive step towards telling a clearer and more holistic story of movements in productivity. Flash estimates of labour productivity produced using the latest labour market statistics and the gross value added (GVA) first quarterly estimates are published separately to the productivity bulletin. The combination of the flash estimates and the productivity economic commentary allows users to see more-timely estimates and later more-detailed estimates, providing balanced reporting. Many users told us they are broadly happy with ONS’s productivity statistical bulletins, but they also pointed out that headline estimates change little from one quarter to the next, and comparisons over longer time periods are more meaningful. They would like to see more discussion of the reasons for longer-term changes, and the statistical uncertainty around the changes. Improving the presentation of the statistics will help aid appropriate interpretation of the statistics. One user suggested that infographics or short videos could be a useful way of helping the understanding of the story of productivity in the UK. ONS productivity analysts told us they were constrained by the limitations of the ONS webpage capabilities. However, we consider that enhanced use of alternative platforms such as Twitter, which ONS has been using to good effect, could add helpful insights for users. The ‘At A Glance’ tables in the productivity bulletin could be presented in a way that is less-complex for users. ONS might find it valuable to look at how the Australian Productivity Commission presents its ‘At A Glance’ statistics.
Productivity analysts in ONS said they recognise the broad interest in productivity statistics and make efforts to communicate with a wide range of users. However, these statistics are also vital inputs used by key users for very important purposes, such as the Bank of England for setting interest rates. ONS thus necessarily focuses more of its efforts on these users than the public, although it tries to cater for all. Our assessment is that ONS should go further and ensure that its statistics are communicated in such a way that promotes use by all types of users.
ONS provides only cursory information about the strengths and limitations of these statistics and data in statistical bulletins and provides links for users to more extensive quality and methods information (QMI). This minimises the burden for users that do not wish to examine lengthy methodology documentation and means that information about quality does exist for those that are interested. However, we judge that more information upfront about whether there have been changes in the understanding of the statisticians about the statistics’ suitability for their intended uses would be helpful. We understand that measures introduced in May 2021 to have word limits on ONS bulletins might delay the full implementation of this.
Back to topRelevance to users
ONS engages with bodies that have proven interests in productivity. They include ONS Economic Experts Working Group, the Economic Statistics Centre of Excellence (ESCoE) and the Devolved Economic Statistics Coordination Group. ONS also engages with other stakeholders such as the Bank of England, HM Treasury, Office for Budget Responsibility and the Department for Business, Energy and Industrial Strategy and productivity research bodies such as the Productivity Insights Network and the Productivity Institute at the University of Manchester. ONS was good before the pandemic at sharing its work outwardly. ONS told us that such engagement has informed its understanding of the use and potential use of its statistics and data. We consider that ONS could be clearer about how feedback it receives about its statistics from its engagement leads to the developments it proposes to the statistics.
ONS had not approached some of the users we spoke to in the last few years with a view to seeking their feedback about using the statistics. We recognise that analysts in the productivity team face competing demands between producing high quality statistics and meeting wider users’ needs, particularly as these often require additional engagement and resources. Outreach to users such as microdata users might lead to developments in the data and the usability of data that would aid their use. We recognise that secure data users do not always engage with ONS productivity analysts directly and may engage with other staff in ONS. To meet the needs of all users there may need to be better coordination of engagement with statistics and data users inside ONS. To be effective, user engagement needs to be planned and collaborative. ONS might find guidance that OSR recently published on user engagement helpful in suggesting ways to engage better with its existing users and identify new potential stakeholders.
Two significant reports in the last five years have influenced ONS’s development of its productivity statistics suite. Based on an international review of productivity that ONS commissioned and a recommendation arising from the independent review of economic statistics carried out by Sir Charles Bean, ONS recently prioritised the development of more-frequent (quarterly) multi-factor productivity statistics. During our engagement with users, we found that whilst users welcome more-timely statistics, they were more ambivalent about more-frequent statistics; being far-more interested in long-term compositional changes and in-depth analysis. MFP statistics users told us that they use the quarterly estimates but notice that the quarterly changes tend to be modest. Since the onset of the pandemic, while ONS has largely continued to produce frequent, timely statistics, it has not been able to fully carry out intended developments of the statistics and at the same time publish the same volume of impressive insightful research. ONS should be transparent about the extent to which the views received from users, potential users and other stakeholders can be addressed. Feedback should be provided to them about how their needs can and cannot be met, being transparent about reasons for the decisions made and any constraints. The productivity statistics team recently ran a user survey, which will help better understand the needs of its users and develop priorities for the statistics that support them; we commend this initiative. Additionally, ONS is also planning to run a Productivity Statistics User Event in the third week of May 2021. These initiatives could help to inform ONS about users’ priorities.
ONS’s productivity outputs are used by a wide range of users. We found MFP to be favoured by more expert users, whilst others reported that it is a difficult concept to communicate to stakeholders, particularly in the policymaking space. ONS plans to develop the MFP measures, but we advise that more effort on promoting the adoption of the MFP measures is likely to be needed as well.
ONS set out ambitious development priorities for these statistics in 2018, but has found making progress against these more challenging than anticipated, due to both the onset of the pandemic and staff changes. ONS told us that it is updating its development plan for the statistics and plans to publish this in May 2021. A plan that is more discriminating about what is possible to achieve in the medium-term and what ambitions may take longer to realise will help to ensure that priorities are met going forward.
Back to topFindings and Requirements
Findings
Economic shocks such as the COVID-19 pandemic and Brexit mean that there’s even greater urgency in understanding ONS’s latest research. Limited ONS people resources mean that continuing to provide new insights into UK productivity has been and continues to be challenging
Examples
- There is an exciting research and development programme which may throw light on the nature of the significant turning point in the UK’s productivity growth in 2008
- ONS has published several useful analytical articles but the rate of new articles has slowed
- ONS produces thousands of datasets on labour productivity. Additionally, it produces multi-factor, regional and firm-level productivity data. Volume production and maintenance of the required production system creates pressure on people resources leaving limited capacity for publishing research insights and development of the statistics
There are no dedicated development resources in the ONS productivity teams
Requirement
ONS should find a more appropriate balance, in conjunction with users, between statistical production, the development of the statistics to meet users’ needs and publishing insightful analysis which informs understanding of the impacts of economic shocks on different aspects of the productivity puzzles
Findings
Presentation of the story of productivity in the UK is disjointed and often overly influenced by recent movements.
Comment on productivity, particularly about multi-factor productivity can assume a high-level of background understanding on behalf of the users.
ONS provides cursory information alongside its statistics about the strengths and limitations of the statistics and data.
Examples
- Descriptions and narrative around changes and trends can often use difficult language which could be off-putting to less-expert users
- In its October to December 2019 UK Labour Productivity statistics ONS said that it would continue to present changes in growth as log percentage changes. This made the measurement of growth consistent to how growth is measured in some other productivity statistics. However, by April 2021 ONS had stopped presenting log percentage growth in labour productivity. Public sector productivity and multi-factor productivity changes are presented as log changes
- Users may not gain an understanding of changes to the quality of the statistics as descriptions of changes to the quality in the statistics bulletin are vague
- Users told us that they would like ONS to better communicate and explain the capital stocks data to users and how to use it
Requirements
- ONS should:
- provide commentary that joins up what’s happening to trends in productivity and explains the evolving story of productivity in the UK
- explain the reasons for its selection of the periods for presenting productivity trends
- further develop the use of platforms such as Twitter to illustrate the statistics better, including with suitable data visualisations such as charts, maps, and tables to help aid interpretation of the statistics
- check that presentation of the statistics and data meets the needs of different types of users
- improve the accessibility and readability of productivity data for programming languages
- find ways of articulating the statistician’s judgement about the fitness of purpose of the productivity statistics
Findings
ONS reaches out to users through user events which tend to focus on communications to users. These events offer few opportunities for feedback from users. There are some gaps in the bodies ONS engages with.
Examples
- ONS could do more to proactively engage with all kinds of users
- We received some feedback that problems with accessing secure productivity microdata persist and that the ONS team engaging with secure access users of productivity data could engage more fully with such users to understand and meet their needs as far as possible
- Users favour deeper analysis of trends and compositional changes over more-regular statistics
- There seems to be a slow adoption of the MFP statistics in the policy community
Requirements
ONS should:
- find the right people to engage with, have productive conversations with those people and follow through on those conversations in terms of developing the statistics and statistics services
- establish the barriers to the adoption of MFP by the policy communities, encourage the use of MFP amongst such users and extend its outreach to that community
- be transparent about the extent to which the views received from users, potential users and other stakeholders can be addressed.