
Defining Statistical Literacy
2.1 Definitions
Many definitions of statistical literacy have been proposed but there appears to be no consensus on how exactly statistical literacy should be defined (Sharma, 2017). The definitions identified through this review could be broadly grouped into either:
- Statistical literacy for students within an educational context or
- Statistical literacy for adults as data consumers within society
Context is just one of the factors driving the differences in definitions of statistical literacy. This section explores the factors causing variability in how statistical literacy is defined, and which components of statistical literacy are common across definitions.
2.1.1 Foundational Knowledge
At the most basic level, models of statistical literacy can include the foundational abilities required to engage with statistics (Chick & Pierce, 2013; Gal, 2002; Lehohla, 2002; ProCivicStat Partners, 2018; Schield, 1999). For example, Gal (2002) proposed that statistical literacy comprises both knowledge and dispositional elements (namely, critical stance, beliefs and attitudes). As well as knowledge of statistics, knowledge elements also include general literacy, understanding of context, critical questions, and numeracy skills. A number of definitions also mention the ability to “read” numbers and data which necessitates numeracy and literacy skills (Chick & Pierce, 2013; Lehohla, 2002; Schield, 1999). Although these foundational abilities are crucial in achieving statistical literacy, they are not included in all definitions. These low-level abilities are likely assumed to be implicit within the inclusion of more advanced skill sets.
The inclusion of foundational abilities in definitions of statistical literacy may be driven by contextual factors. The definition produced by Gal (2002) considers statistical literacy among adults who are data consumers in diverse life contexts. Whereas definitions produced in educational contexts (e.g. Ben-Zvi & Garfield, 2004), to develop assessments and teaching plans, may be narrower and foundational abilities such as general literacy and mathematical ability may be out of scope.
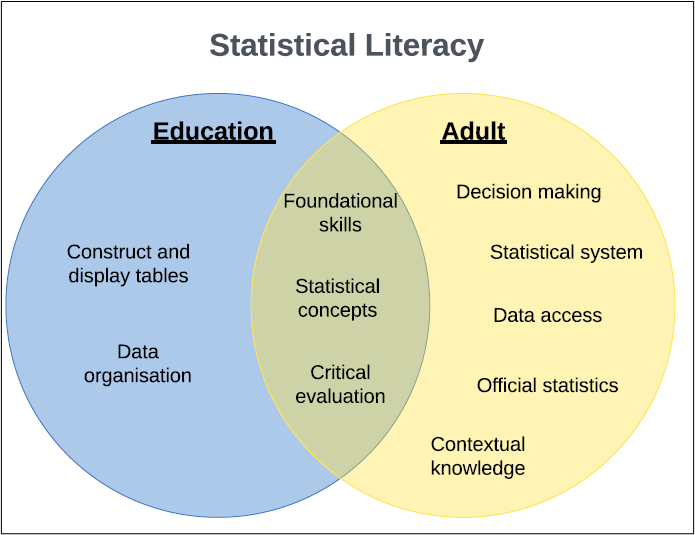
Figure 1: Statistical Literacy components grouped by context. It shows A venn diagram showing the crossover of the statistical literacy components, grouped by the contexts of ‘Education’ and ‘Adult’. Education features ‘construct and display tables’, and ‘data organisation’. Adult features ‘decision making’, ‘statistical systems’, ‘data access’, official statistics’, and contextual knowledge’. Both groups contain ‘foundational skills’, ‘statistical concepts’, and ‘critical evaluation’.
2.1.2 Statistical Concepts
Knowledge and understanding of statistical concepts are ubiquitous in definitions of statistical literacy. As well as being one of the aforementioned knowledge elements in Gal’s model of statistical literacy (2002), Ben-Zvi and Garfield (2004), make the distinction between statistical literacy, statistical reasoning, and statistical thinking. In this instance, statistical literacy includes an understanding of data organisation, table construction, probability as a measure of uncertainty, symbols, and vocabulary. Ben-Zvi and Garfield (2004) are statistical educators and therefore consider individuals as both data consumers and data producers. This is reflected in the knowledge they consider to be necessary for statistical literacy, namely practical abilities such as table construction.
When proposing the knowledge base required to engage with civic statistics, as part of the ProCivicStat project (a partnership between six different academic institutions to promote civic engagement), “statistics and risk”, “models, patterns and representations” and “methodology and enquiry processes” were included (ProCivicStat Partners, 2018). Differences in the knowledge components specified as necessary to achieve statistical literacy may be prompted by two factors. Firstly, the ProCivicStat project considers individuals primarily as citizens and data consumers, without the data-producing role which would typically be considered within statistics education.
A second contributing factor relates to the types of statistics considered. Civic statistics, the focus of the ProCivicStat project, are “statistics about important societal trends and about topics that matter to the social and economic well-being of citizens” (ProCivicStat Partners, 2018). They assume that “citizens need to be aware of and critically understand statistics regarding past trends, present situations, and possible future changes in key social and economic areas such as demographics, employment, wages, migration, health, crime, poverty, access to services, education, human rights, and public expenditures” (ProCivicStat Partners, 2018). Civic statistics are described as distinctive in that they are typically: multivariate, aggregate, dynamic, communicated through rich text and data visualizations, and embedded in a social context. Overall, although statistical knowledge is a common element of statistical literacy models, the specific concepts that are included can vary depending on the setting and the type of statistics considered.
2.1.3 Critical Thinking
As well as being able to understand the statistical information presented, a consumer of statistical information is also required to take into consideration the quality of the information so that it can be appropriately incorporated into their thinking and decision-making. Within Gal’s statistical literacy model (2002), critical evaluation is captured in both the knowledge- and disposition-related elements. Knowledge of a set of critical “worry questions” is necessary to apply to statistical information to discern its quality (e.g., Is a given graph drawn appropriately or does it distort a trend in the data?). Furthermore, a critical stance is a dispositional element reflecting a person’s questioning attitude, including their willingness to apply the aforementioned worry questions to data that may be misleading or biased. Critical evaluation was also captured in other definitions of statistical literacy (Schield, 1999; Wallman, 1993). For example, Katherine K. Wallman, the President of the American Statistical Association, in 1993 produced a definition, based on her reading across many sources, which many recent models have been based upon: “Statistical literacy is the ability to understand and critically evaluate statistical results that permeate our daily lives – coupled with the ability to appreciate the contributions that statistical thinking can make in public and private, professional and personal decisions” (Wallman, 1993).
2.1.4 Additional Components
Beyond the components of statistical literacy identified as common across definitions, some elements are less frequently mentioned but are nevertheless necessary to engage with statistics in specific contexts. Additional elements which have been considered within definitions of statistical literacy include: incorporating statistical thinking into decision making (Wallman, 1993), ICT and search (ProCivicStat Partners, 2018), being able to access statistical reports and knowing where to source them, as well as wider knowledge of the statistical system which includes knowing where data comes from and how often it is released. The latter components are included particularly in the context of official statistics (Gal & Ograjensek, 2017).
2.1.5 Structure
As well as affecting the content of the definition, context may also impact the structure of the definition. In a review of definitions and models of statistical literacy (Sharma, 2017), Sharma highlighted that the hierarchical structure of the statistical literacy model provided by two statistical educators, Watson and Callingham (2003), may be due to its consideration of students who will undergo assessment. The hierarchy was established by Watson and Callingham for use in a student population, which at the lowest level (idiosyncratic) is associated with basic mathematical skills and advancement to higher levels is associated with more critical engagement with statistics in different contexts, understanding of uncertainty, and more complex statistical concepts (Table 1). Watson and Callingham evaluated their notion of statistical literacy using large-scale data from an 80-item questionnaire on statistical understanding. Their analysis of the questionnaire responses provided support for their conception of statistical literacy as a unidimensional construct with six levels of understanding. In contrast, Gal (2002, 2004) considers adult statistical literacy as a one-level construct containing the necessary components to be statistically literate.
Overall, a vast number of definitions and models of statistical literacy have been proposed. Although there is no consensus across these definitions, some common components have emerged. These are foundational abilities such as literacy and numeracy, knowledge of statistical concepts, and critical engagement with statistical information. Further components were identified which may be relevant to consider in specific contexts such as in official statistics (Gal & Ograjensek, 2017).
Table 1. Levels of Statistical Literacy (Watson & Callingham, 2003)
| Level | Examples of Level Requirements |
|---|---|
|
Critical engagement with context, use of proportional reasoning, appreciation of uncertainty. |
|
Critical engagement in familiar and unfamiliar contexts (not involving proportional reasoning), use of appropriate terminology. |
|
Non-critical engagement with context, use of terminology, statistical skills e.g., mean, probabilities, graphs. |
|
Selective engagement with context, qualitative use of statistical ideas, recognise conclusions without justification. |
|
Colloquial or informal engagement with context, basic calculations. |
|
idiosyncratic engagement with context, tautological use of terminology, and basic mathematical skills |
2.2 Measurement tools
The lack of consensus regarding the definition of statistical literacy and other related and overlapping concepts such as data literacy makes it difficult to measure consistently (Open Data Institute, 2022). A number of tools to measure statistical literacy were identified during the review process which may shed further light on how to define statistical literacy.
Though all of the tools identified were developed to measure statistical literacy, context was once again an important factor. The context in which the tools were developed, as well as their wider purpose, substantially affected how they were constructed. For example, the Partnership in Statistics for Development in the 21st Century (PARIS21) Secretariat established a task team to develop a global indicator of statistical literacy. The Statistical Literacy Indicator (SLI) was developed to assess literacy at the country level and is based on articles produced by the countries’ national newspapers (Klein et al., 2016; PARIS21, 2021). For this measure, statistical literacy is determined using a text mining approach to detect whether the media uses words representing the higher levels of the aforementioned statistical literacy hierarchy proposed by Watson and Callingham (2003; Levels 4-6 in Table 1). Level one here is the “Consistent, non-critical” use of statistics, Level two is “Critical” engagement with statistics and Level three is “Critical mathematical” engagement with statistics. A score is then estimated for each country, which is the percentage of national newspaper articles that contain references to statistics and use key words related to levels one, two and three summed (score ranging from 0 to 300). This tool has some clear limitations. One that was identified by the producers of the tool, was that in many developing countries the press releases from statistical agencies were used verbatim within their articles rather than editing them for their audience (Klein et al., 2016). This would artificially inflate the countries’ literacy score. Another limitation is that it only factors in one type of national media, not including television or radio (PARIS21, 2016).
The review also identified two statistical literacy measures for use in a student population. Although, numerous measures were identified that capture statistical knowledge, the following measures have been developed to assess statistical literacy specifically. Detail is provided on the two assessments below which are the reasoning and literacy assessment (REALI; Sabbag et al., 2018) and Basic Literacy in Statistics (BLIS; Ziegler, 2014).
REALI (Sabbag et al., 2018) was developed for use in educational settings and estimates statistical literacy at the individual level, assessing performance on a series of questions. This assessment distinguishes between statistical literacy and statistical reasoning. Statistical literacy in this framework refers to knowledge of statistics and statistical reasoning is the ability to make more high-level connections between statistical concepts. Being critical of the statistics is not captured explicitly within either of these constructs; however, it is argued that the items used do “contemplate students’ ability to be critical of statistical information” (Sabbag et al., 2018).
The definition of statistical literacy used in the construction of BLIS (Ziegler & Garfield, 2018) was “the ability to read, understand and communicate statistical information.” BLIS is a 37-item assessment testing knowledge in areas such as data production, confidence intervals and regression. BLIS is once again more focused on detecting statistical knowledge rather than an individual’s critical assessment abilities. Furthermore, they are both aiming to encompass the learning aims of introductory statistics courses.
The pattern we see across the tools captured in this review is that assessments and definitions that arise from an educational context appear to focus more on statistical knowledge. When the aim is to ascertain levels of statistical literacy within the general public and society, critical engagement is a much more central factor. Only a small number of tools were identified from the review therefore the strength of the conclusions are limited. Evidence from the use of these tools to estimate statistical literacy in the general public is discussed in the “Knowledge” section of this report.
Summary
Overall, the review captured various definitions of statistical literacy. In line with a prior review (Sharma, 2017), there appears to be no consensus on how exactly statistical literacy should be defined. The development process underlying these definitions was also often unclear. There are some commonly used components including foundational abilities, knowledge of statistical concepts, and critical thinking. Differences between definitions are especially apparent when comparing those produced for students and those for adults in society. A definition broad enough to apply to all contexts may lose utility. An alternative approach for future attempts at defining statistical literacy may be to consider first the context where the definition will be applied and then specify the components required for statistical literacy in that context. An example of this approach is displayed in Figure 1 where components of statistical literacy are grouped by context (Education and Adult).
Back to top