The journey to improving income-based poverty statistics

The Office for Statistics Regulation (OSR) recognises the important role that organisations play, both within and outside of Government, in seeking to understand poverty through data and statistics. In response to our ‘income-based poverty’ review published in 2021, in our latest guest blog, Ainslie Woods, the Income and Earnings Coherence Lead at the Office for National Statistics (ONS) discusses how government statistic producers are working together to improve poverty statistics.

For more information about our regulatory work please sign up for our newsletter.

With the rising cost-of-living in the UK, there is an ever-growing public and policy interest in the effect this is having on poverty levels. Poverty is a term commonly used by the media, politicians, policy makers and the public – but what does it really mean and how do we measure it?

My role, as the Income and Earnings Coherence Lead, is to work with official producers from the Department for Work and Pensions (DWP), the Office for National Statistics (ONS) and HM Revenue and Customs (HMRC) to improve the coherence and accessibility of our statistics. Following OSR’s 2021 income-based poverty statistics review and related blog, the trouble with measuring poverty, we’ve been working with statistical producers to help build the bigger picture on poverty in the UK – so what has been done?

What do we mean by poverty?

Poverty can be defined in terms of household disposable income, which can be used to identify those on low income, commonly referred to as income-based poverty statistics. The statistics are one of many factors used to inform key policy decisions such as the recent increase to the National Living Wage.

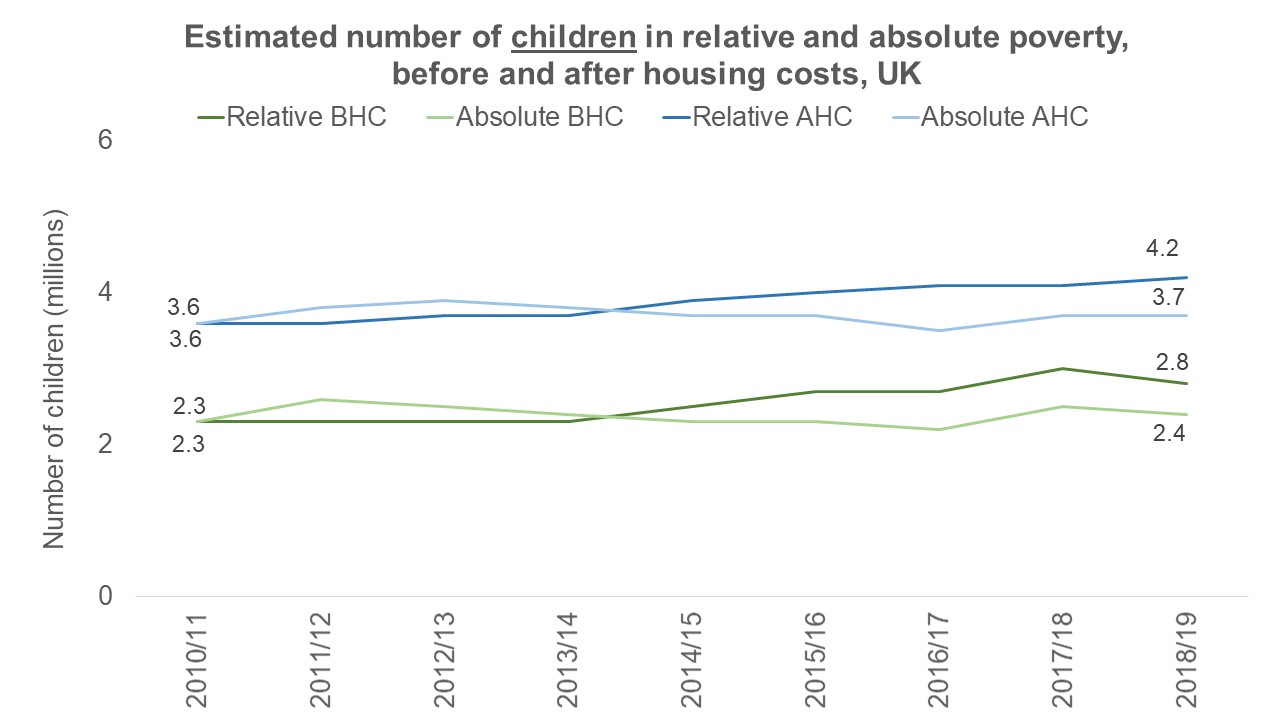
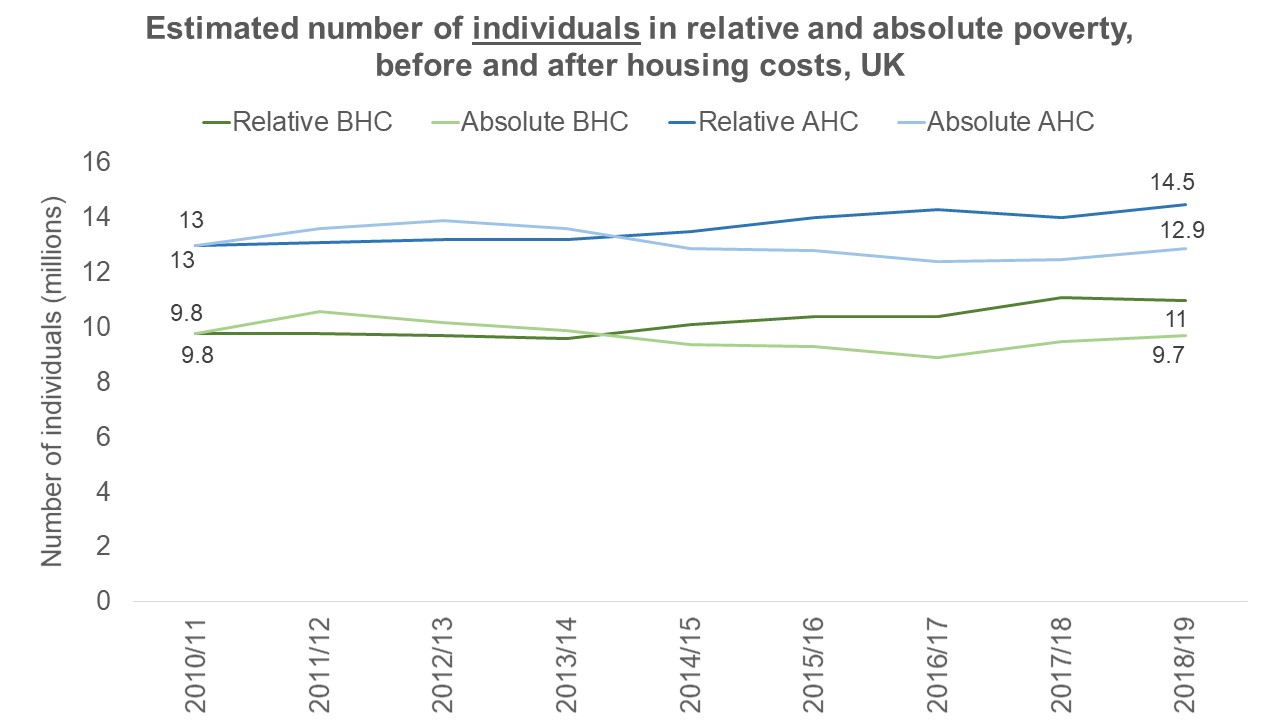
Poverty, as defined in terms of disposable household income, is commonly measured using two approaches:

  • people in relative low income (households with less than 60% of median income)
  • people in absolute low income (households with less than 60% of the median income in 2010/11, held constant in real terms).

These approaches can both be measured before housing costs and after housing costs. The statistics are published annually by DWP in its Households Below Average Income (HBAI) publication.

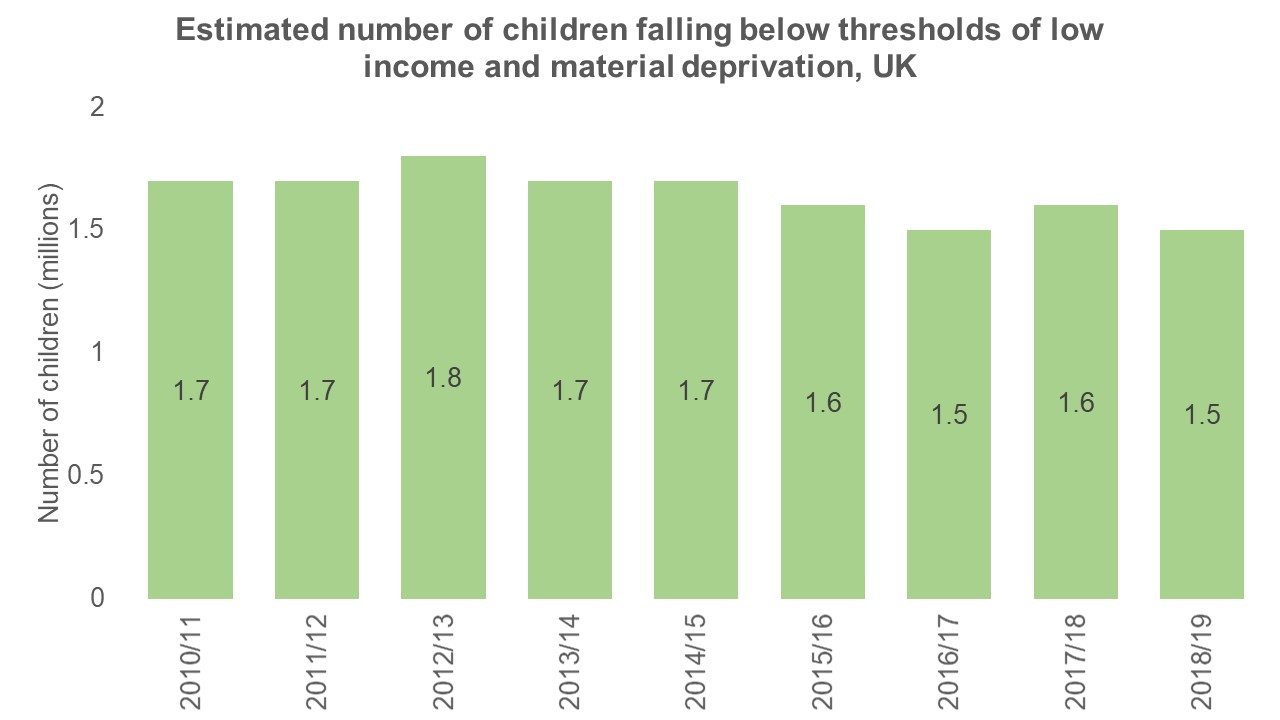
Although low income is an important aspect of poverty, there are other facets of poverty too. The HBAI publication also includes data on ‘material deprivation’, which provides an indication of people’s ability to access or afford a range of everyday goods and services.

Measures of persistent low income (used as a measure of persistent poverty) are available in DWP’s annual Income Dynamics publication. It is widely agreed that the impact of long-term poverty on individuals is worse than when poverty is experienced only for a short time, therefore these statistics provide important additional information to the HBAI release.

The ONS has also historically produced income-based poverty statistics. Prior to the UK’s exit from the EU, this was mainly through Eurostat. The ONS is exploring the user need for these statistics with a view to re-introducing poverty statistics, possibly within an annual financial wellbeing publication. User views on the future of ONS poverty statistics are welcomed as part of the transforming the ONS’s household financial statistics consultation which closes on 23 February 2023. ONS continues to engage with a wide range of stakeholders on the use of poverty statistics, including the Social Metrics Commission (SMC) following its September 2018 report ‘A New Measure of Poverty in the UK’.

Improvements to our statistics

In late 2020, representatives from ONS, DWP and HMRC came together to form our cross-Government Income and Earnings Coherence Steering Group which provides the overarching direction, insight, and leadership needed to deliver improvements. We want to ensure we are producing high quality data and analysis to inform the UK, improve lives and build the future.

In response to OSR’s review, we have implemented a range of improvements, including;

Longer-term work is also progressing well as we continue to review methods and work to maximise the use of administrative data, including;

  • DWP’s existing long-term work to develop integrated survey-administrative datasets (see section 2.5 of DWP’s statistical work programme).
  • ONS’s transformation of its household financial statistics (including household income, expenditure and wealth). By combining current surveys into a single survey, in conjunction with alternative data sources, it will be possible to deliver higher quality, more timely and in-depth analysis of households’ financial well-being. The transforming the ONS’s household financial statistics consultation (and associated blog) closes on 23 February 2023. A consultation response will be published in Spring 2023.
  • ONS’s research on the potential use of administrative data to produce social statistics for a range of population characteristics, including ethnicity and income. Experimental admin-based income statistics (ABIS) provide a useful early prototype that demonstrates how administrative data sources can be used to measure occupied address (household) income. ONS has also started to explore the potential for administrative data to produce a measure of income by ethnicity by combining two admin-based datasets. ONS is in the early stages of exploring this, but it has released an initial case study on producing admin-based income by ethnicity statistics (ABIES) for England.

As part of our follow-up engagement with OSR, I have been regularly liaising with Vicky Stone, OSR’s Labour Market and Welfare Lead and it is very encouraging to hear that OSR are pleased with the improvements made so far.

Where next?

As the rise in the cost-of-living continues, more and more emphasis will be placed on these statistics by Government and decision makers. It is my role, in conjunction with relevant producers, to ensure that collaborative cross-Government work continues, and I look forward to continuing to work with users and the OSR. While many of the statistics are UK wide, statistical producers across the UK will continue to work closely with the Devolved Governments of the UK to understand their needs and priorities. For more information on our planned work and progress please see our collaborative plan which was updated on 18 January 2023.

Cost of Living Crisis: Unpicking and Understanding the data gaps

In our latest blog, Statistics Regulators Vicky Stone and Chris Davies look at the role of statistics in the Cost of Living Crisis debate.

As the UK’s statistics regulator, our vision is simple. Statistics should serve the public good – and to meet this ambition, in part, statistics should be able to answer questions that users are interested in. 

A very current and topical question in our minds at present is how well do statistics inform the debate around the cost-of-living crisis and are there any data gaps? Whilst on the face of it this is a very simple question, the cost-of-living crisis is actually a very tricky concept to unpick and understand.  

The statistical system currently provides a range of high-quality statistics that measure component parts, such as income and earnings, prices, inflation, household spending patterns, income-based poverty, and fuel poverty statistics. This blog focuses on data gaps identified within three of the component parts; understanding increases in prices, the impact on family resources and spending and levels of income-based poverty.

Many households are facing increases in expenditure on different goods and services – and this varies from household to household.  Increasing prices of essential items such as food and energy may impact on the financial position of households and may also have an impact on overall poverty levels. For example, the Resolution Foundation estimates that an extra 1.3 million people will fall into absolute poverty in 2023, including 500,000 children. 

Statistics are needed to inform our understanding on how rising fuel, energy and food prices are affecting different households and people across the UK. Statistical producers have responded well to user demand for additional information on the cost-of-living crisis. This blog acknowledges some great work through case studies and identifies data gaps in three areas. 

The impact of inflation on households with varying incomes

Headline rates of inflation, or the general increase in prices, are well captured by the Office for National Statistics (ONS) current suite of inflation statistics. However, there is a remaining challenge in understanding varying inflation faced by those on different incomes. Using new data sources, including scanner and web scraped data, ONS is developing measures of inflation which reflect the lived inflation experience of households. These measures include a personal inflation calculator, for people to measure the affect cost of living increases has had on them in the past year; Household Cost Indices, which measure UK households’ experience of changing prices and costs; an analysis of lowest cost items, which will for example, identify lower-price items for a shopping list of essential items; and bespoke analysis on Inflation and the cost of living of UK Households, overview June 2022. 

These measures, along with subgroup analysis of the Consumer Prices Index including owner occupiers’ housing costs (CPIH) and the Consumer Prices Index (CPI), represent part of ONS’s Transformation of Consumer Prices and Cost of Living analysis programmes, which in part, have been developed to respond to the public debate led by Jack Monroe on the representativeness of official measures of price inflation for individuals on low incomes. 

Case study 1: Filling the data gaps

On 30 May 2022, ONS published experimental analysis tracking the price of the lowest-cost grocery items, UK, experimental analysis: April 2021 to April 2022 as a first step to understanding varying price inflation experienced by individuals on low incomes.

A summary of ONS’s current and future analytical work related to cost of living is available here.

The impact of increasing costs on family resources and spending

Statistics on income and spending are generally presented on a household basis and based on surveys covering people living in private households, such as the Family Resources Survey (FRS) and the Living Costs and Food Survey (LCF). In our review of income-based poverty statistics we identified a number of data gaps in coverage and granularity of the statistics. Household surveys exclude homeless people and those not residing in private households, such as care homes, halls of residence and prisons. These groups are likely to be living at the lowest end of the income distribution and therefore are an important omission from the statistics.

More recently, the Inclusive Data Taskforce 2021 report also identified a number of critical gaps in the collection of personal characteristic data. A number of groups were repeatedly identified with basic demographic information missing, such as non-household populations. In line with recommendations of that report, the recording of demographic information must be improved to ensure more data inclusivity.

Case study 2: Filling the data gaps

Following our assessment in 2021 of the LCF survey, ONS has demonstrated its commitment to improve the statistics in line with our requirements and recommendations. We are encouraged to hear that the Household Financial Statistics Transformation (HFST) project aims to exploit alternative data sources to establish a more integrated and efficient survey of household finances. DWP is also investing in the Family Resources Survey by introducing a significant boost in the sample and making good progress on a transformation programme to integrate survey and administrative data. This work aims to improve the quality, timeliness and granularity of the statistics, to improve insight and understanding of income, wealth, spending and financial resilience across the UK.

The impact on levels of income-based poverty

The concept of poverty means different things to different people and there are a number of different measures commonly used to understand income-based poverty. The UK’s official poverty estimates are published in the annual Household Below Average Income (HBAI) statistics by the Department for Work and Pensions (DWP); with the latest statistics published in March 2022, covering up to FYE 2021. The same week, ONS published its annual household income inequality statistics also providing estimates of household incomes and inequality in the UK covering FYE 2021. Whilst these statistics are the official sources on household and individual incomes in the UK, they do not cover most recent effects of rising living costs; as highlighted by the Joseph Rowntree Foundation. 

OSR 2021 Poverty review

Our review of income-based poverty statistics was published in May 2021 and whilst many of our recommendations still stand – we have seen some good progress in response to our work including;

Case study 3: Filling the data gaps

ONS regularly publishes insightful analysis on the cost of living in Great Britain using the Opinions and Lifestyle Survey. The survey was adapted quickly to collect social insights data during the COVID-19 pandemic and covers impact on health and wellbeing and goods shortages as well as the cost of living. Data are published on the ONS website, most recently via the Public Opinions and Social Trends bulletin, and is available to accredited researchers via the Secure Research Service (SRS).

Looking Forward

As the cost-of living crisis continues to unfold, people will want to know how increasing prices will affect them and understand associated levels of income-based poverty – and plugging the data gaps will be crucial in understanding the complexities more fully to make change and ease the burden on people. 

For more information on our regulatory work in this space, please follow us on Twitter @StatsRegulation and subscribe to our newsletter.

What is Levelling Up and how will its success be measured?

‘Levelling Up’ is now a term used daily in the media – but what does it mean and how are we, as the statistics watchdog, going to monitor its impact? Statistics Regulator Ben Bohane discusses…

Not long before I joined OSR as a Regulator, the Conservative Party made ‘Levelling Up’ a key part of their 2019 election manifesto. It focused on challenging and changing the geographical inequality in the UK, through investment and new infrastructure to allow ‘everyone the opportunity to flourish’.

Prior to working at OSR, I taught Economics to young people as a Secondary School teacher. I found teaching young people how changes in the economy and government spending might impact on their lives – really rewarding. I think back to those young people now – do they understand what Levelling Up is amongst the media hype? How will the proposals that are outlined in the Levelling Up White Paper impact their lives and futures?

If I were to explain it to my students now, I would describe Levelling Up as a plan to eradicate regional disparities in the UK, raise living standards and provide greater opportunities to people, in communities and areas that have so far not had the success of more prosperous parts of the country.

But with confusion over the concept really means – how can we measure something for which the success means different things to different people? Back in March, OSR’s Director Ed Humpherson wrote about ‘Why I Love Evaluation’ stating that evaluation “provides evidence of what works; it supports good policy; it builds the skills and reputation of analysts; it helps scrutiny.” Ongoing evaluation of Levelling Up will be key to its success.

In OSR our focus is on ensuring existing statistics that can be used to measure the success of government policy are of sufficient trustworthiness, quality and provide public value. But also, that statistics are available in the first place. As the government highlights in the White Paper, many of the metrics that will be used to measure the success of Levelling Up are either not yet available or of insufficient quality. The clarity of what’s being measured is important if people want to track progress through data.

In OSR we’ve already been working on public interest in regional disparities and fighting for a statistical system that is more responsive to regional and local demands. We have:

Our Business Plan highlights that we have seen a growing public expectation that decisions affecting all aspects of our lives will be evidenced by trustworthy and accessible statistics. Over the coming months and years, we will continue to review new statistics and data sources from the Department for Levelling Up, Housing and Communities, Office for National Statistics and other data providers as they are developed to ensure that evidence and evaluation is at the forefront of pushing the plans forward.

Our regulatory programme for this year focuses on projects that will improve public understanding of the issues, current and emerging, that people want to be sighted on. As the statistics regulator, reviewing the statistics used in Levelling Up, we will be tracking the implementation of the GSS Sub National Data strategy and new tools such as the ONS Sub National Indicators Explorer, ensuring statistics are the best quality they can be and clearly focussed on measuring the outlined Levelling Up missions.

Statistics supported by clear analysis and evaluation will provide the evidence to measure the impacts, successes and failures of Levelling Up – and any future government policies to address regional disparities and improve people’s lives. As the government implements policies to address regional inequalities – and businesses and households respond – we will focus on ensuring that the statistics both accurately measure and live up to this ambitious long-term strategy. It is important to me as a statistics regulator that we do this. After all, the vision of Levelling Up is so important to the futures of those young people I used to teach.


Appendix 1: Background foundation work on surveys that are used to produce economic statistics

ONS Purchases Survey statistics  (December 2019):

ONS reintroduce the survey following the National Statistics Quality Review of National Accounts to provide better information about purchasing patterns by business.

Our review found that the quality of outputs from the survey is still being improved, which reflected ONS’s own narrative that it would normally be several years before a new survey was producing statistics that could be used with confidence. It also reflected that the Annual Purchases Survey aims to collect variables that do not naturally fit with many businesses’ operational models. Our report noted the discrepancy between estimates of intermediate consumption derived from the Annual Purchases Survey and the Annual Business Survey. We said that it is an essential part of demonstrating that the quality of the statistics meets users’ needs that these differences are understood, explained well, and are used to further improve the statistics.

ONS UK Business Demography statistics (October 2020)

We reviewed ONS Business Demography statistics because we felt they should be considered key economic indicators. They are not regarded as such because they are not as good or as useful as they should be. The ONS’s business register – the Inter-Departmental Business Register (IDBR) – holds a wealth of data on the UK’s business population, some of which are used to produce business demography statistics. The remainder of which remain a largely untapped resource. In response to the COVID pandemic, ONS introduced a weekly indicator of business births and deaths and introduced a quarterly series of experimental business demography statistics. These innovations presented a platform for further development of the statistics. However some required improvements to the statistics rely on significant investment and we said that work to develop ONS’s business register should urgently be re-introduced to ensure that users’ needs for business population statistics are met. In our review we made several short-term recommendations for ONS:

  • demonstrate progress in understanding the access difficulties users are experiencing when using and linking IDBR data with data
  • publish its plans for publishing more timely business demography statistics, and its plans for developing the recently introduced quarterly experimental statistics
  • publish a narrative covering what ONS already knows about the range of key data quality issues, building on the supporting quality information provided with the new quarterly experimental statistics
  • publish its plans to restart and resource work to develop its business register

We also said in the longer term, ONS should publish a plan which includes specific actions, deliverables and a timetable that explains how it will address the improvements identified in the report, including plans for reviewing the funding of the Statistical Business Register.

ONS Annual Business Survey statistics (September 2021)

We reviewed ONS ABS and found that the significant time delay on the publication of ABS data means that the data are not always used to measure the ongoing impacts of structural and cyclical changes to the UK economy. As a result, ABS data are not fully meeting users’ needs for timely and detailed data on business performance.

We found ONS focus and priority on transforming short-term surveys means there has been a lack of investment in finance, staff, and systems and so ABS data have been unable to keep up with changing demands on their use. The lack of investment has curtailed ONS’s efforts to improve the detail and timeliness of ABS data.

We found a lack of investment has been a common theme of OSR’s recent assessments of ONS’s structural economic surveys and statistics. We strongly urged ONS to revisit the investment needs of these outputs, to ensure structural economic data are available to assess, for example, the ongoing impact of the economic shocks of Brexit and the pandemic.

Appendix 2: OSR work on regional statistics and Levelling Up

ONS Statistics on Regional Gross Value Added (August 2017)

“Many of the R-GVA users that we spoke to cited poor timeliness as a limitation of these statistics” and “that unless the R-GVA statisticians find new sources that provide the same level of detailed information more quickly than the current sources (which they indicated to us is unlikely in the short term), the timeliness of these statistics is unlikely to change significantly”.

“ONS might do more to bring out the differences between the regions through the proportions of people in the region who are economically inactive, which can affect the GVA per head statistics and the impact of commuting on the statistics” and requested ONS “to work with its national and regional stakeholders to bolster the statistical services such as information, advice and guidance available to provide even greater insight in sub-regions (particularly new city-regions) and in preparing contextual information to aid regional and country media in interpreting the statistics”.

ONS Statistics on Regional Gross Value Added (Phase Two) (June 2018)

We asked ONS to make further improvements, for example, “investigate whether improvements in the quality of deflators by adopting regional price statistics could be achieved technically and cost-effectively taking account of expected use of the statistics and user need”. We also asked ONS to “review the best way of making quality metrics both more useable to a less expert audience and more accessible generally”.

HM Treasury Statistics on Government Spending: Country and Regional Analysis (May 2019)

We asked HM Treasury to:

  • collaborate with producers of other public finance statistics and with analysts in the countries and regions to seek views, update their understanding of users’ needs to better support the use of these statistics
  • communicate effectively with the widest possible audience to increase awareness of the statistics and data
  • present CRA data in a more engaging way that supports and promotes use by all types of users and those with interests in spending at programme and service levels (sub functional levels)
  • test the strength of user need for CRA on a ‘where-benefits’ basis, examine the feasibility of collecting data on this basis and the trade-off between enhanced functionality and increased burden on data suppliers
  • provide a clear and comprehensive account in each annual CRA publication to allocation methods, including the inclusion of links to published documents about allocation methods in respect to all ongoing major project spending
  • ensure that users are provided with appropriate insights about changes in the data. This should include helping users understand impacts on the CRA data and provide links, when applicable, to other output areas where information on Brexit impacts has already been published
  • establish a development programme for these statistics and periodically review that programme; be open about progress towards meeting priorities and objectives; and arrange for users and other stakeholders to be involved in prioritising statistical plans
  • strengthen its arrangements for reviewing requests to allow pre-release access to new people; review the current list of those with pre-release access for CRA, with a view to minimising the numbers of individuals included and inform the Authority of the justification for each inclusion

ONS Experimental statistics on Regional Household Final Consumption Expenditure (HFCE) (January 2021)

We highlighted the potential of HFCE estimates as a highly important component in fully understanding regional economies. Prior to this there were no regional estimates of the expenditure measure of GDP, except in Scotland, a topic we previously highlighted in our 2020 submission to the Treasury Select Committee’s inquiry into Regional Imbalances.

DLUHC Levelling Up Fund prospectus (March 2021)

The Levelling Up Fund prospectus included a list of local authorities by priority category.

However, initially no description of the methodology used was attached to enable users to understand how local authorities were allocated to priorities areas. A week later a DLUHC published a methodology document, but it was still not possible to recreate the full dataset used to allocate local authorities to priorities areas.

We wrote to DLUHC publicly highlighting our concerns about the transparency of data related to the Levelling Up Fund and we requested DLUHC publish data that supported the allocation of priorities areas to enhance public confidence in the decisions that were being made.

As a result, DLUHC published the Levelling Up Fund: prioritisation of places model, which showed all the steps that were taken when using data to assign Local Authorities in England, Scotland and Wales to categories 1, 2 and 3. The spreadsheet included a “data and input construction” tab which included links to the source data with explanations of the source and why it was chosen.

ONS Foreign Direct Investment (FDI)  Statistics and DIT Inward Investment Statistics (April 2021)

As a result of our review new questions were added to the quarterly and annual FDI surveys, to collect more-granular data on sub-national FDI and ONS is now publishing experimental UK sub-national FDI statistics.

NISRA BESES statistics (December 2021)

As a result of our review, NISRA will be publishing more timely imports data and has developed an interactive dashboard that provides more-granular monthly international trade data on products.

ONS Income Estimates for Small Areas statistics (January 2022)

We suggested how further value could be added by ONS understanding the needs of current non-users who require income estimates at lower levels of geography.

Users’ want to be able to aggregate estimates for lower-level super output areas into bespoke geographies, the estimates are given for middle-layer super output areas which are too large for users’ needs.

DLUHC planning applications in England statistics and at the same time Homes England Housing Statistics (March 2022)

We felt at the time it was likely that planning performance and planning reforms will in some part be included in new Levelling up legislation, given its assumed focus on local area development.

LA planning application performance at the time had also been identified as a priority departmental outcomes metric in the 2021 Spending Review.

We advised further developments to the statistics. One of these developments included sub-national commentary, which should be introduced to help explore, for example, trends in planning to support regeneration in the 20 English towns and cities prioritised in the Levelling Up white paper.

We found the statistics could be further enhanced if Homes England were to publish information about aspects of quality, for example, limitations of data sources, quality assurance checks carried out by data suppliers, and the team’s assessment of data quality against our quality assurance of administrative data (QAAD) matrix

We also asked Homes England to consider how any uncertainty in the statistics might be more clearly communicated to users, as the latest data are provisional and subject to revision.

Finally, we suggested further insight and context should be added by enhancing the narrative and analysis provided for users who wish to explore the topic further.

Appendix 3: Treasury Committee evidence

2019 response

Key point

There is a range of official statistics on regional economic performance. They should be considered alongside other forms of data published by Government and others.

What we said

All data, whether classified as official statistics or not, should seek to adhere to high standards of trustworthiness, quality and value (which we describe as voluntary adoption of the Code of Practice’s pillars).

Key point

There are some limitations to the current data sources, both in terms of data gaps and in terms of quality.

What we said

In our written evidence referring to regional economic data, we highlighted “the quality of regional data is affected by the granularity that the data sources can provide, and/or the timeliness of the data provision”. Regional data is more volatile than national estimates and there are significant challenges in forming regional estimates of GDP.

We said “In arriving at aggregate estimates, statisticians often combine both administrative and survey data sources….and then disaggregate to provide regional breakdowns (a top-down approach). Survey data is often limited in its depth: for example, the data used to compile R-GVA can become stretched at lower geographies, becoming increasingly volatile as it is disaggregated further.”

Key point

There is a significant use of modelled data, which apportions national data to regions using formulae, rather than directly observed data, which would be gathered at the local level.

What we said

“During our regulatory work, we received feedback from users of regional and sub-regional economic data expressing concern that they can’t tell whether the data they are using is based on observed economic behaviour or come from modelled estimates. They view data based on observed estimates as more reliable than modelled estimates”.

At our request, the ONS conducted research into how much data measuring economic growth are directly observed at a regional level and collected in a way that can be immediately and wholly assigned to a single region, and how much data are modelled to provide regional estimates.

Key point

It may be worth considering a network of regional statistical observatories, akin to the Bank of England’s regional agents, that can help provide ONS and others with better insight into regional economic issues.

What we said

We wanted to highlight the benefits of a presence outside the offices of London, Newport and Titchfield – both to better understand the dynamic of regional economies, and to be closer to users with a regional focus (like combined mayoral authorities).

2020 response

“Developments [in regional statistics] will be enabled by better access to administrative data, where ONS can provide enhanced (ideally flexible) geographies with more use of direct estimation”.

“Regional performance information published by the UK Government can be found in some departmental annual reports and accounts but is not summarised in any compendium”.

We laid out several important conditions for publishing regional economic forecasts that could be adopted to help people make judgements about the UK and regional economy.

One of these conditions was: “It would be important to communicate the uncertainties associated with any regional GVA forecasts. For example, there are deficiencies in historical GVA data. Forecasts will only be as good as the data they rely on”.

The people behind the Office for Statistics Regulation in 2020

This year I’ve written 9 blogs, ranging from an exploration of data gaps to a celebration of the armchair epidemiologists. I was thinking of making it to double figures, setting out my reflections across a tumultuous year. And describing my pride in what the Office for Statistics Regulation team has delivered. But, as so often in OSR, the team is way ahead of me. They’ve pulled together their own year-end reflections into a short summary. Their pride in their work, and their commitment to the public good of statistics, really say far more than anything I could write; it’s just a much better summary.

So here it is (merry Christmas)

Ed Humpherson

Donna Livesey – Business Manager

2020 has been a hard year for everyone, with many very personally affected by the pandemic. Moving from a bustling office environment to living and working home alone had the potential to make for a pretty lonely existence, but I’ve been very lucky.

This year has only confirmed what a special group of people I work with in OSR. Everyone has been working very hard but we have taken time to support each other, to continue to work collaboratively to find creative solutions to new challenges, and to generously share our lives, be it our families or our menagerie of pets, all be it virtually.

I am so proud to work with a team that have such a passion for ensuring the public get the statistics and data they need to make sense of the world around them, while showing empathy for the pressures producers of statistics are under at this time.

We all know that the public will continue to look to us beyond the pandemic, as the independent regulator, to ensure statistics honestly and transparently answer the important questions about the longer term impacts on all aspects of our lives, and our childrens’ lives. I know we are all ready for that challenge, as we are all ready for that day when we can all get together in person.


Caroline Jones – Statistics Regulator, Health and Social Care Lead

2020 started off under lockdown, with the nation gripped by the COVID-19 pandemic and avidly perusing the daily number of deaths, number of tests, volume of hospitalisations and number of vaccines. This level of anxiety has pushed more people into contacting OSR to ask for better statistics, and it has been a privilege to work at the vanguard of the improvement to the statistics.

To manage the workload, the Health domain met daily with Mary (Deputy Director for Regulation) and Katy, who manages our casework, so we could coordinate the volume of health related casework we were getting in. We felt it important to deal sympathetically with statistic producers, who have been under immense pressure this year, to ensure they changed their outputs to ensure they were producing the best statistics possible. It’s been rewarding to be part of that improvement and change, but we still have a lot of work to do in 2021 to continue to advocate for better social and community care statistics.


Leah Skinner – Digital Communications Officer

As a communications professional who loves words, I very often stop and wonder how I ended up working in an environment with so many numbers. But if 2020 has taught me anything, it’s that the communication of those numbers, in a way that the public can understand, is crucial to make sure that the public have trust in statistics.

This has made me reflect on my own work, and I am more determined than ever to make our work, complex as it can be, as accessible and as understandable to our audiences as possible. For me, the highlight of this year has been watching our audience grow as we have improved our Twitter outputs and launched our own website. I really enjoy seeing people who have never reached out to us before contacting us to work with us, whether it be to do with Voluntary Application of the Code, or to highlight casework.

As truly awful as 2020 has been, it is clear now that the public are far more aware of how statistics affect our everyday lives, and this empowers us to ask more questions about the quality and trustworthiness of data and hold organisations to account when the data isn’t good enough.


Mark Pont – Assessment Programme Lead

For me, through the challenges of 2020, it’s been great to see the OSR team show itself as a supportive regulator. Of course we’ve made some strong interventions where these have been needed to champion the public good of statistics and data. But much of our influence comes through the support and challenge we offer to statistics producers.

We published some of our findings in the form of rapid regulatory review letters. However, much of our support and challenge was behind the scenes, which is just as valuable.

During the early days of the pandemic we had uncountable chats with teams across the statistical system as they wrestled with how to generate the important insights that many of us needed. All this in the absence of the usual long-standing data sources and while protecting often restricted and vulnerable workforces who were adapting to new ways of working. It was fantastic to walk through those exciting developments with statistical producers, seeing first-hand the rapid exploitation of new data sources.

2021 will still be challenging for many of us. Hopefully many aspects of life will start to return to something closer to what we were used to. But I think the statistical system, including us as regulators, will start 2021 from a much higher base than 2020 and I look forward to seeing many more exciting developments in the world of official statistics.


Emily Carless – Statistics Regulator, Children, Education and Skills Lead

2020 has been a challenging year for producers and users of children, education and skills statistics which has had a life changing impact on the people who the statistics are about.  We started the year polishing the report of our review of post-16 education and skills statistics and are finishing it polishing the report of our review of the approach to developing the statistical models designed for awarding grades.  These statistical models had a profound impact on young people’s lives and on public confidence in statistics and statistical models.

As in other domains, statistics have needed to be developed quickly to meet the need for data on the impact of the pandemic on children and the education system, and to inform decisions such as those around re-opening schools. The demand for statistics in this area continues to grow to ensure that the impact of the pandemic on this generation can be fully understood.

The trouble with measuring poverty

We have since published a Review of Income-based poverty statistics from the time of this blog’s release.

What does it mean to be in poverty? It’s a question that has been debated for a long time and is one of the reasons why measuring poverty is so difficult. There are many interest groups and think tanks who have covered this issue time and time again, such as the Joseph Rowntree Foundation and Full Fact.

The concept of poverty means different things to different people and to some extent, requires a judgement call to be made as to where to draw the poverty line. Generally speaking, being in poverty refers to when people lack financial resources to afford to meet their basic needs.

While it may be difficult to define, it is important for central and local governments to understand the prevalence and nature of poverty in the areas they serve so that they can put targeted support in place. This blog looks at what data is out there to measure poverty and highlights the work being done to improve the future evidence base on poverty.

So what is the best measure of poverty?

There is no right or wrong measure of poverty. Different measures of poverty capture different things, and trends in these measures can vary over time.

No single figure about poverty tells the whole story so context is really important when drawing comparisons of poverty over time.

There are four commonly used income-based measures of poverty produced annually by the Department for Work and Pensions (DWP) in its Households Below Average Income (HBAI) National Statistics publication:

  • Relative poverty (relative low income) – households which have less than 60% of contemporary median income
  • Absolute poverty (absolute low income) – households which have less than 60% of the median income in 2010/11 held constant in real terms
  • Both relative and absolute poverty can be measured on a before housing costs (BHC) or after housing costs (AHC) basis.

These four measures are published by children, pensioners, working-age adults and all individuals. The data below shows the latest figures for children and all individuals. Across all measures, we can see that the number of children in poverty has increased since 2010/11. For all individuals in poverty, the picture is more complicated as the total number in absolute poverty has seen a decrease in this time (by 100,000 individuals both before and after housing costs) whilst the number of individuals in relative poverty has seen an increase (from 9.8 million to 11 million before housing costs and from 13 million to 14.5 after housing costs).

Chart showing the estimated number of children in relative and absolute poverty, before and after housing costs, UK

Source: DWP Households below average income, 1994/95 to 2018/19

Chart showing the estimated number of individuals in relative and absolute poverty, before and after housing costs, UK

Source: DWP Households below average income, 1994/95 to 2018/19

As well as these four measures, DWP produces statistics on material deprivation. This is where an individual or household can’t afford certain necessities and activities that are measured by a basket of goods.

The DWP publishes estimates of the number of children falling below thresholds of low income and material deprivation in its HBAI statistics. The questions underpinning this measure were updated in 2010/11 and the DWP is clear that figures from the old and new suite of questions are not comparable. Since 2010/11, the number of children falling below thresholds of low income and material deprivation has fallen by 200,000.

Chart showing the estimated number of children falling below thresholds of low income and material deprivation, UK

Source: DWP Households below average income, 1994/95 to 2018/19

Material deprivation on its own is not widely used as a measure of poverty as it is not designed to measure low income. However, the combined measure of low income and material deprivation offers a wider measure of people’s living standards which can be used to look at elements of persistent poverty. This measure was the basis of one of the targets set in the Child Poverty Act 2010 aimed at reducing child poverty.

Outside the world of official statistics, there is another measure of poverty produced by the Social Metrics Commission (SMC). The SMC is an independent group of experts formed to develop a new approach to poverty measurement that both better reflects the nature and experiences of poverty that different families in the UK have, and can be used to build a consensus around poverty measurement and action in the UK.

It has been publishing its poverty measure since 2018 which is considered to be the most comprehensive measure of poverty available as it covers the depth, persistence and lived experience of poverty.

What more can be done to improve the evidence base on poverty?

The SMC has been working with the DWP to publish experimental statistics in 2020 that will look to take the current SMC measure and assess whether and how this can be developed and improved further to increase the value of these statistics to the public.

These experimental statistics will be published in addition to the HBAI publication, which will continue to produce the four recognised income-based measures of poverty highlighted earlier. The work on developing these statistics has been paused due to the Covid-19 pandemic but the DWP remains committed to carrying out this work.

Poverty remains a significant issue for the UK and has the potential to be of greater importance as we adjust to life following Covid-19. This is why we are launching a systemic review on the coherence of poverty statistics in Autumn 2020.

We will provide more information on the scope of the systemic review on our website later this year and we look forward to engaging with the public to understand how the quality and public value of official statistics on poverty can be improved, to help facilitate open and fair public debate.

The fact that there are different ways of measuring poverty should help build the bigger picture on poverty in the UK and should not be used as an excuse to be selective with data to support only part of the story. This is something the Chair of the UK Statistics Authority commented on back in 2017, when referring to the then Prime Minister’s comments on child poverty:

We do, however, feel that public debate would be enhanced if the Government indicated more clearly which measure or measures it places greatest weight on and that it was consistent in reporting progress against this measure. It is unhelpful if there is regular switching between what constitutes the key measure.”

Measuring poverty is complicated. There is no wrong measure but there is a wrong way of using the available measures – and that is to pick and choose which statistics to use based on what best suits the argument you happen to be making. It is important to look at all the data available and set the context when referring to statistics on poverty.

The benefits of collaboration: working together to improve the evidence base on deprivation

How statisticians in the four nations are working together to improve the evidence base on deprivation

Deprivation is a complex concept. The term is often used interchangeably with poverty (which relates to a lack of income to meet basic needs) when in fact deprivation refers to a serious lack of something which is considered to be a basic necessity in society. From healthcare to housing, there are multiple factors which determine how deprived an area is. In recent weeks, deprivation has hit the headlines in relation to the COVID-19 pandemic. Analysis published by the Office for National Statistics found that people living in more deprived areas have continued to experience COVID-19 mortality rates more than double those living in less deprived areas.

It therefore remains crucial that data are made available to identify the most disadvantaged areas and to build the evidence base on the different facets of deprivation. The indices of multiple deprivation are an important tool for achieving this and for supporting decisions about addressing local needs. They are a relative measure which look at how deprived different areas are compared to one another. This means an area may see improvements in absolute terms (such as increased job prospects) but still fall in the overall rankings if other areas have also experienced improvements. The indices are widely used by central and local government and community organisations to target their services.

Today we released a series of letters about our review of the indices of multiple deprivation produced by the Ministry of Housing, Communities and Local Government (MHCLG) , the Welsh Government and the Scottish Government . We didn’t review the statistics produced by the Northern Ireland Statistics and Research Agency (NISRA ) as these are produced to a different time scale.

Our review identified some real strengths and opportunities in the way the statistics teams have worked together to improve the public value of the statistics. They all spoke positively about being part of a ‘four nations group’ which works collaboratively to make guidance and presentation across the deprivation statistics more consistent. There were two areas in particular that we feel have benefited from this joined up working.


Putting users first

One thing that became clear in our conversations with each of the teams is that they have a good understanding of the uses and users of their respective statistics. The statistics are relied upon for local decision making and interventions, which is something the statisticians are keen to prioritise in the development of the indices.

As part of its regular meetings, the four nations keep each other updated on emerging areas of user interest and reoccurring queries from the public to remain alert to developments in this field. Even the frequency of the statistics is determined by user need. We discovered that it can be a burden on local authorities and third sector organisations who use the statistics in their own analyses if the indices are updated too regularly – particularly where changes between years are slow moving. Similarly, users are at the heart of any methodological changes to the construction of the indices between iterations – these are carefully considered and reviewed by domain experts and key user groups.


Bringing the data to life

There has been a collective effort by the teams to demonstrate the relevance of the statistics to users and help them understand the complexity of deprivation. From interactive maps, to pen pictures, to case studies, the producers have tailored their outputs to bring out the key messages whilst also offering the flexibility to delve deeper into the data. For example, MHCLG has recently published a new mapping tool which allows users to visualise the statistics at new geographical levels including Westminster Parliamentary Constituencies and Travel to Work areas.

The Welsh Government and Scottish Government also publish their own interactive tools. Alongside this, we found the Scottish Government’s analysis of deep-rooted deprivation (areas that have remained the most deprived in previous iterations of the index) is an innovative way of bringing out insight from the statistics whilst addressing the limitations of the statistics in a way which can be understood by all. We were pleased to see that the Welsh Government took inspiration from this and has also carried out analysis of deep-rooted deprivation in Wales. The team in MHCLG has welcomed our recommendation to agree and adopt a common definition of deep-rooted deprivation with the Welsh and Scottish Governments, to further improve harmonisation and consistency across the indices of multiple deprivation.

To summarise, the indices of multiple deprivation are a fascinating set of statistics which have benefited from collaboration between the statistics teams in the four nations. The statistics continue to be relevant to a wide range of users and the teams’ collective approach to putting users at the centre of the statistics presents further opportunities for developing the public value of the statistics going forward. We look forward to seeing these opportunities realised in the future.

Closing data gaps: understanding the impact of Covid-19 on income

In recent weeks, you may have spoken with friends and family who’ve seen their income and living standards impacted in some way by COVID-19. They may have been furloughed and are concerned about whether they will have a job to return to or perhaps they have experienced a reduction in business if they are self-employed. Maybe your own household is receiving less income and you are struggling to juggle household costs with home schooling.

Despite the UK starting to ease the lockdown measures it introduced in response to COVID-19, the impact of this pandemic on the labour market and people’s livelihoods is expected to continue for some time. We are already seeing signs of the scale of the impact on the labour market; from vacancies at a record low in May to new claims to Universal Credit passing 2.5 million between March and June. The Office for National Statistics (ONS) recently brought forward the launch of its online Labour Market Survey to help provide the necessary insight into the impact of COVID-19 on people’s employment and working patterns.

There is a range of data which can help us understand how jobs and employment have been affected but we need better data on income and earnings to fully understand the narrative of how people’s livelihoods and living standards are being affected by the pandemic. A recent Opinions and Lifestyle Survey by the ONS found that half of the self-employed reported a loss of household income, compared with 22% of employees, in the month of April. Last year, we wrote to the ONS, Department for Work and Pensions and HMRC to restate the importance of delivering the insights identified in our work on the Coherence and Accessibility of Official Statistics on Income and Earnings. Whilst some progress has been made since our findings were published in 2014, it has been slow to date and more work needs to be done to help users understand the dynamics of the labour market and to address key data gaps in relation to income and earnings.

We have recently carried out work to look at examples of data gaps being addressed in the statistical system. Our work found three common themes in successful cases of solving data gaps: sufficient resource (whether new or restructured), high user demand and strong statistical leadership. The combination of new user demand for information on income and earnings that has emerged from COVID-19, restructured resource that has been put in place to respond to this demand, and the potential for statistical leadership to shine, could be the catalyst for solving these data gaps.

Improving the storytelling of income and earnings and addressing the data gaps identified by OSR could help users better understand the lived experience of households and different employment types throughout the pandemic. These are difficult times for many people from all walks of life and people are facing lots of unknowns. It is important that we can understand the true scale of the impact so that when the UK begins its recovery from the pandemic, support can be targeted effectively towards the groups most severely affected. There are two areas in particular in which solving data gaps could improve our understanding of COVID-19.

 Household level data is not keeping pace with individuals

Household measures of income and earnings have traditionally been less timely than measures for individuals and this formed a key area of our findings in the work highlighted above. With respect to COVID-19, there is interest in understanding how the Government’s income support measures have impacted income for different household types such as those with children or lone parent households. Even in households which are not receiving any income support, people may have had to adapt their working patterns to share the responsibility of childcare which may lead to one or both of the earners in a household working reduced hours on potentially reduced pay. HMRC has published data which shows that 9.1 million jobs had been furloughed by mid-June but we won’t see any contextual data about the impact on households until 2022 in the Family Resources Survey. We hope the relevant statistical teams explore new ways to deliver this insight in the meantime.

 There are lots we don’t know about the world of the self-employed and business owners

It is notoriously difficult to capture information on the income and earnings of the self-employed or those who own businesses. This is because many earn less that the taxable allowance so are not captured in statistics relating to income tax and many don’t have predictable earnings so we don’t know what they’ll earn until well after the year end. The surveys which do manage to collect information on the self-employed are less timely than those for employees. When the Chancellor announced the Self-Employment Income Support Scheme, it quickly emerged that more people would need the support than originally anticipated and that the eligibility criteria would need to be adjusted to reflect the various ways that the self-employed can pay themselves. Improving the timeliness and completeness of information on the income of the self-employed could help identify groups of individuals who currently fall through the gaps of eligibility for the income support schemes in place.

Employment and jobs statistics: a microcosm of the statistical system

The world of work has changed dramatically over the last decade. The employment rate in the UK has seen record highs in recent years, and the way that people work has become much more flexible, with a large increase in self-employment and part-time working. The UK employment and jobs statistics, produced by the Office for National Statistics (ONS), are hugely valuable because they help us understand what the labour market looks like and how it is changing over time.

Now, more than ever, these statistics need to be able to keep pace with a changing environment: COVID-19 has caused an unprecedented challenge to the labour market and wider economy. It is crucial that we are able to measure and understand the impact, as the public needs statistics that help them understand the scale and nature of the changes. We have been impressed by the agility and pragmatism of ONS in its response to the COVID-19 outbreak so far.

Today we have published documents covering the trustworthiness, quality and value of the employment and jobs statistics produced by ONS and statisticians in the Welsh Government, the Scottish Government and the Northern Ireland Statistics and Research Agency, to examine their value for all users across the UK.

Our assessment is an interesting case study of the common issues that statistics producers face. It really is a microcosm of the UK statistical system. We came across many recurring themes from our other regulatory work including: the potential of administrative data to generate insight and fill data gaps, the need for clear and prominent information about statistical uncertainty, and coherence of data and statistics. This blog explores these themes and may offer some wider lessons for producers of official statistics.

Using administrative data sources to fill gaps in insight

To understand how the labour market is changing, we need statistics that capture all aspects of employment and jobs. There are still a number of data gaps, for example, measures of job quality and data on the self-employed. ONS is already taking positive steps to explore opportunities to fill data gaps, such as its collaboration with HMRC to use their Pay As You Earn (PAYE) Real-Time Information (RTI). Access to these data offers huge potential to enhance the value of the statistics because it captures detailed information on all employees on the PAYE system. ONS should focus its efforts on understanding how RTI data can be integrated with existing data sources to maximise the value of the statistics. Active and ambitious leadership from ONS is vital to achieving this change. It would be helpful for users if ONS published regular updates on these statistical developments to enhance the transparency of its plans.

Being clearer on uncertainty in the estimates

The employment and jobs statistics are mostly based on household and business survey data, which means that they are only estimates of the true number of people of in employment and the number of jobs. An indication of the level of uncertainty around the headline estimate is useful because it allows users to understand whether changes over time or differences between countries or regions are meaningful. In other words, are the changes real or are they an artefact of the way that households or businesses are sampled? Our view, endorsed by the users we spoke to, is that uncertainty is not properly reflected in the messaging in ONS statistical bulletins. This means readers might jump to the conclusion that the figures in the bulletins and tables are more precise than they really are. We have asked ONS to integrate information on uncertainty and explain reasons for changes.

Ensuring statistics and data sources are coherent

Coherence reflects the degree of similarity between related statistics and the insight that can be achieved by drawing them together. The coherence of the employment and jobs statistics was identified as a key strength in both our assessment of ONS’s statistics and our review of labour market statistics in the devolved nations. The statistics are consistent over time, comparable across geographical areas and the definitions are in line with international best practice, which reflects their quality. However, we heard from some users that there are issues with coherence of certain data sources, including the headline estimates from the Labour Force Survey (LFS) and Annual Population Survey (APS). This is a challenge for ONS, especially at the current time when COVID-19 is dramatically changing the way LFS data are collected. To enhance the quality of the statistics, it is important that ONS and its partner statistics teams in the devolved nations work effectively together to enhance the value provided to users of statistics in their own nations and across the UK.

Employment growth statistics: a case study in curiosity-driven quality improvement

Albert Einstein was reputed to have said that curiosity has its own reason for existing and the important thing is not to stop questioning. This blog is a case study example of the value of indulging curiosity to help strengthen the quality of valuable official statistics- and in this blog we look at ONS’s Employees in the UK statistics from Business Register and Employment Survey (BRES) survey data. Professor Sir Charlie Bean in his 2016  Independent Review of UK economic statistics, reflected that to better understand the modern economy and people’s lived experiences of the economy, ONS statisticians should be more curious about their statistics and what stories they are telling. He set out three inter-linked ingredients that are needed to help meet this objective of building a ‘curious’ ONS that is more responsive to changes in the economic environment and better meets evolving user needs.

Three inter-linked ingredients of building a more curious ONS

Chart 1 Three inter-linked ingredients of building a more curious ONS: Strengthen QA, improve appreciation of the statistics in use, raising staff knowledge.

Source: Independent Review of UK economic statistics, Sir Charles Bean


In early summer of 2018, Cambridge Ahead (CA), a membership organisation involving people and organisations dedicated to the successful growth of the Greater Cambridgeshire region, contacted both OSR (the Office for Statistics Regulation) and ONS. CA drew our attention to their concerns about a lack of alignment between employment growth estimates for the region from its own database compared to those from ONS’s BRES-sourced statistics as exemplified in Chart 2 below: Source: Analysis provided by CBR based on latest data

Ed Humpherson, Director General, Office for Statistics Regulation.

Chart 2 showing Average employment growth over six year 2012-2018 comparing BRES and CA estimates.

After engaging with ONS and CA we felt that engagement between the two organisations provided an opportunity for ONS to pursue a potentially new way of testing the quality of the BRES estimates. The purpose of this blog is not to go into the detail about the reasons why the estimates don’t align, we are more interested in how the curiosity could lead to improving the insight and quality of these employment statistics.

We saw that ONS and CA, exchanged details of their methods and details about their data. Both appreciated the strengths of the other – for example BRES offers labour market data at low levels of geography and CA’s analysis introduces a greater understanding of the employment market in this region.

ONS has described BRES statistics as providing a comprehensive picture of jobs in the UK but recognise that these statistics, like most derived from sample surveys, display some limitations and may not immediately pick up new businesses. ONS intends through its transformation programme to source employment numbers from PAYE income tax data. This offers the potential to give ONS close to real-time employment information from every business with a PAYE scheme, including newer businesses. This would provide a wealth of new information that ONS can use to provide even more detail and more timely figures for statistics users.

While this is exciting news and very much to be welcomed, developments like these can take time to implement. We feel there are more immediate opportunities to strengthen the insight that these statistics offer to users as well as quality assurance of the source data.

CA believe that they have a comparative advantage compared with ONS in capturing smaller companies, which don’t get picked up on the IDBR (Inter-Departmental Business Register – the sampling frame for the ONS data) due to such businesses not being registered for VAT or PAYE purposes. In an area with a lot of small start-up companies, this could be a significant cause of differences.  The sample allocation for BRES was last reviewed 10 years ago. Sample re-allocation is important because of changes in the economy over time; the existing allocation may not reflect the current structure of the labour market. In the OSR’s assessment of ONS’s Labour Markets Statistics we have required ONS to review and update the sample allocation (our Requirement 7a). We expect ONS to have acted upon our requirement by March 2021 with a formal update on a quarterly basis. In the meantime, ONS should publish an action plan which sets out its proposals for addressing the Requirements.

What has been instructive about ONS opening its data to scrutiny and challenge is that the engagement progressed beyond an attempt merely to reconcile differences in estimates. The challenge posed by the alternative estimates has been the impetus to check out the reasons why and question whether the methods and current checks used to produce BRES estimates are adequate. The engagement has been successful in that it has been a key input to some of the requirements that the OSR has made in its assessment of ONS’s labour market statistics leading to better employment statistics not just for one region but for all regions throughout the UK.

ONS is keen to continue to engage with CA to help better understand the labour market in Cambridge and Peterborough. This curiosity work between ONS and CA underscores the importance of covering all three of Sir Charlie Bean’s ingredients of curiosity – improving the appreciation of the statistics in use, raising staff’s knowledge and strengthening the quality assurance. This was always an exercise in taking advantage of additional data to see whether official statistics could be improved. In this respect curiosity has proved that it has a very important reason to exist.