Why misleading statistics should never become a catchphrase

In our latest blog, Head of Casework Elise Rohan, talks about the problem with the repeated use of misleading statistics and how you can combat this.

I have always been a fan of the show Catchphrase. The joy of being able to recall expressions and idioms without always understanding what they mean or where they come from. They are just phrases I have heard repeated elsewhere.

Our ability to remember things we have heard repeated isn’t limited to words. Have you ever found yourself quoting a statistic and struggling to remember where you first heard it? Such as; two-thirds of lottery winners end up broke or that half of all marriages end in divorce.

As our world becomes more abundant with data, statistics are increasingly used to persuade and provoke discussion – from daytime television to debates in Parliament. In many cases, statistics are seen as a tool to strengthen weak arguments.

At OSR, our vision is that statistics should serve the public good. A big part of that is encouraging their use in wider debate, but it also involves combating and safeguarding against misleading statistics.

What do we mean by misleading statistics?

Misleading statistics are those that misrepresent data either intentionally or not. We have developed a definition of misleadingness in the context of our work as statistics regulator which is:

“We are concerned when, on a question of significant public interest, the way statistics are used is likely to leave a reasonable person believing something which the full statistical evidence would not support”

Repetition of incorrect or unsupported statistics has the potential to harm our vision and public confidence in statistics. The repeated use of misleading statistics creates a validity through reuse. This is known as the ‘illusory truth effect’ or repetition bias. The more you say something, the more confident you become at saying it. Research on this phenomenon has found that we have a cognitive bias to perceive confidence and fluency as characteristics of truthfulness. I’m sure we can all think of public figures who have been accused spreading ‘fake news’ in this way.

We also see this type of misleadingness in the types of casework we receive in OSR. For example, we recently commented on the repeated use of an unsupported claim concerning sex-based differences in online harassment in the Houses of Parliament. And of course one of our most high-profile interventions concerned repeated claims made about the UK’s contribution to the European Union.


So, what can you do to combat this?

  • Develop the skills to critically challenge what you see.
    • Is a source provided for the figure? If so, is the source reliable?
    • Can you access the underlying information to check and understand the figures for yourself?
    • Is the figure presented in the right context? Is it clear why the time frame has been chosen or why any comparisons have been made?
  • The accuracy of claims is often nuanced rather than a binary true or false – as explained in Tim Harford’s guide to statistics in a misleading age. The House of Commons Library has published guidance on How to spot spin and inappropriate use of statistics.
  • If you see a statistic that feels questionable, try and fact-check it when you first hear it to reduce the influence of the illusory truth effect. Make use of search engines or organisations such as Full Fact to see if the claim has already been checked and commented on.
  • If you’re using statistics to make a claim or support an argument, make sure you help people understand what you’re saying and prevent misinterpretation by following our principles for intelligent transparency. How easily can someone verify what you have said? Is the context for your claim and any limitations clear?
  • Finally, if you see misleading statistics being repeated, get in touch with us. Every year, we receive hundreds of queries, many of which are about misleading statistics. In 2022/23, we dealt with 372 cases, in line with our interventions policy.

One of OSR’s priorities for 2023/24 is to champion the effective communication of statistics to support society’s key information needs. As part of our work to deliver this aim, we are reviewing our existing guidance to understand what more we can do to support the statistical system to use a range of communication methods while preventing and combating misuse.

The trouble with measuring poverty

We have since published a Review of Income-based poverty statistics from the time of this blog’s release.

What does it mean to be in poverty? It’s a question that has been debated for a long time and is one of the reasons why measuring poverty is so difficult. There are many interest groups and think tanks who have covered this issue time and time again, such as the Joseph Rowntree Foundation and Full Fact.

The concept of poverty means different things to different people and to some extent, requires a judgement call to be made as to where to draw the poverty line. Generally speaking, being in poverty refers to when people lack financial resources to afford to meet their basic needs.

While it may be difficult to define, it is important for central and local governments to understand the prevalence and nature of poverty in the areas they serve so that they can put targeted support in place. This blog looks at what data is out there to measure poverty and highlights the work being done to improve the future evidence base on poverty.

So what is the best measure of poverty?

There is no right or wrong measure of poverty. Different measures of poverty capture different things, and trends in these measures can vary over time.

No single figure about poverty tells the whole story so context is really important when drawing comparisons of poverty over time.

There are four commonly used income-based measures of poverty produced annually by the Department for Work and Pensions (DWP) in its Households Below Average Income (HBAI) National Statistics publication:

  • Relative poverty (relative low income) – households which have less than 60% of contemporary median income
  • Absolute poverty (absolute low income) – households which have less than 60% of the median income in 2010/11 held constant in real terms
  • Both relative and absolute poverty can be measured on a before housing costs (BHC) or after housing costs (AHC) basis.

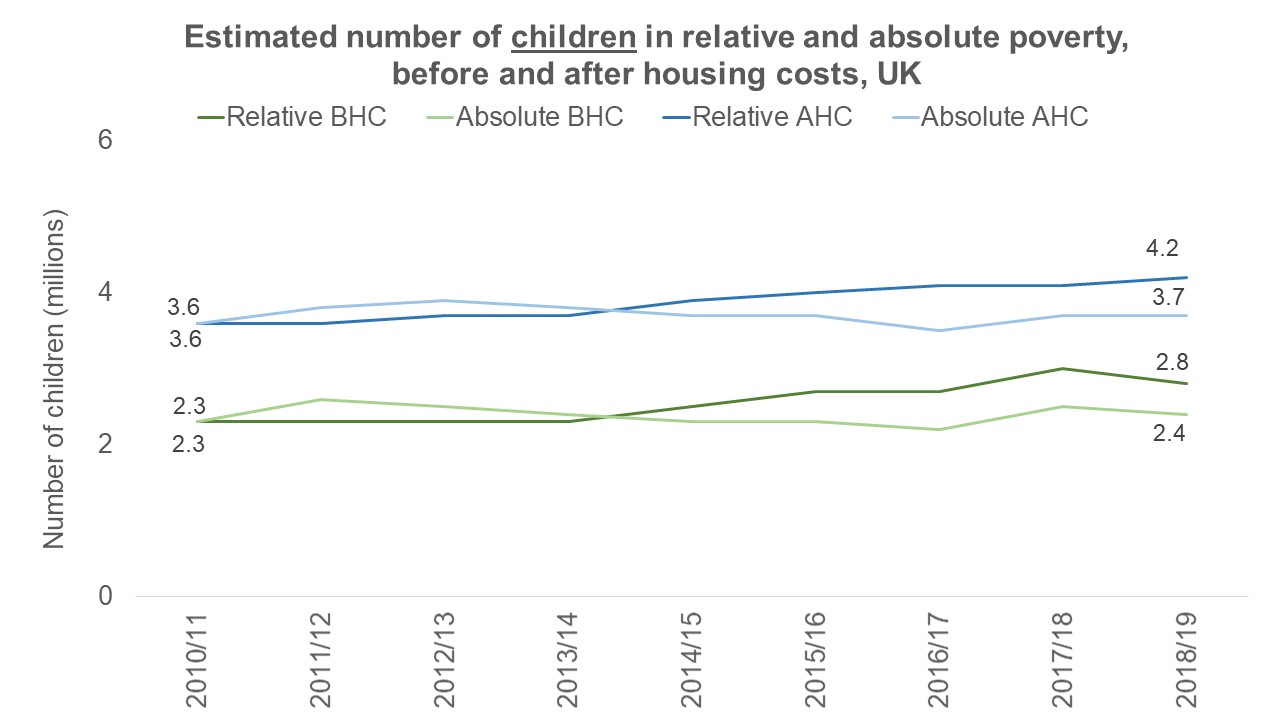
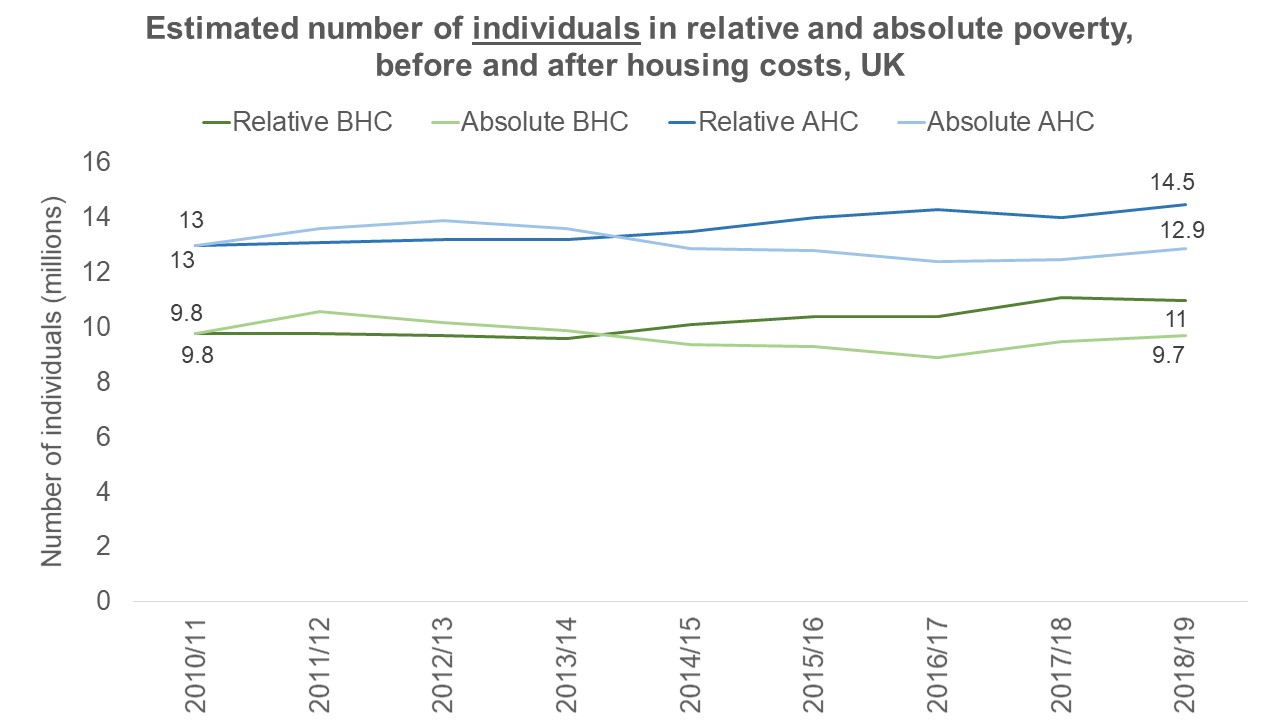
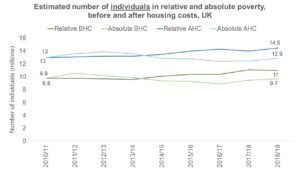
These four measures are published by children, pensioners, working-age adults and all individuals. The data below shows the latest figures for children and all individuals. Across all measures, we can see that the number of children in poverty has increased since 2010/11. For all individuals in poverty, the picture is more complicated as the total number in absolute poverty has seen a decrease in this time (by 100,000 individuals both before and after housing costs) whilst the number of individuals in relative poverty has seen an increase (from 9.8 million to 11 million before housing costs and from 13 million to 14.5 after housing costs).

Chart showing the estimated number of children in relative and absolute poverty, before and after housing costs, UK

Source: DWP Households below average income, 1994/95 to 2018/19

Chart showing the estimated number of individuals in relative and absolute poverty, before and after housing costs, UK

Source: DWP Households below average income, 1994/95 to 2018/19

As well as these four measures, DWP produces statistics on material deprivation. This is where an individual or household can’t afford certain necessities and activities that are measured by a basket of goods.

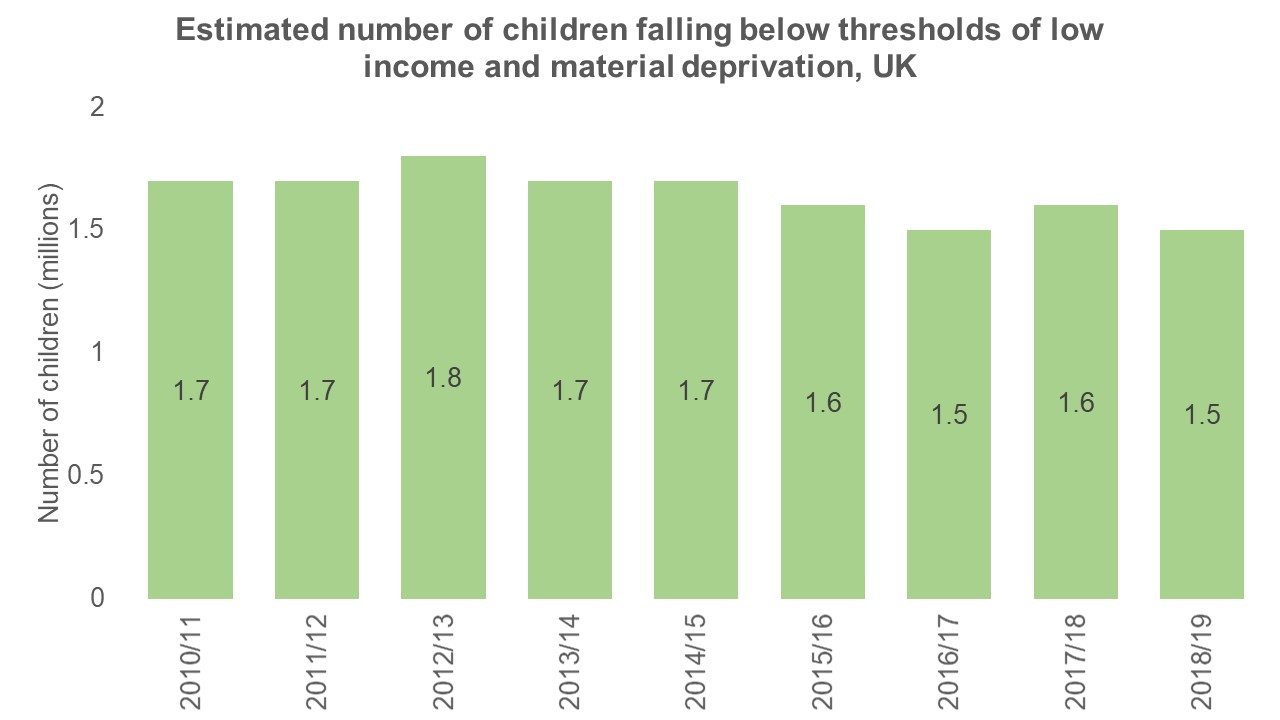
The DWP publishes estimates of the number of children falling below thresholds of low income and material deprivation in its HBAI statistics. The questions underpinning this measure were updated in 2010/11 and the DWP is clear that figures from the old and new suite of questions are not comparable. Since 2010/11, the number of children falling below thresholds of low income and material deprivation has fallen by 200,000.

Chart showing the estimated number of children falling below thresholds of low income and material deprivation, UK

Source: DWP Households below average income, 1994/95 to 2018/19

Material deprivation on its own is not widely used as a measure of poverty as it is not designed to measure low income. However, the combined measure of low income and material deprivation offers a wider measure of people’s living standards which can be used to look at elements of persistent poverty. This measure was the basis of one of the targets set in the Child Poverty Act 2010 aimed at reducing child poverty.

Outside the world of official statistics, there is another measure of poverty produced by the Social Metrics Commission (SMC). The SMC is an independent group of experts formed to develop a new approach to poverty measurement that both better reflects the nature and experiences of poverty that different families in the UK have, and can be used to build a consensus around poverty measurement and action in the UK.

It has been publishing its poverty measure since 2018 which is considered to be the most comprehensive measure of poverty available as it covers the depth, persistence and lived experience of poverty.

What more can be done to improve the evidence base on poverty?

The SMC has been working with the DWP to publish experimental statistics in 2020 that will look to take the current SMC measure and assess whether and how this can be developed and improved further to increase the value of these statistics to the public.

These experimental statistics will be published in addition to the HBAI publication, which will continue to produce the four recognised income-based measures of poverty highlighted earlier. The work on developing these statistics has been paused due to the Covid-19 pandemic but the DWP remains committed to carrying out this work.

Poverty remains a significant issue for the UK and has the potential to be of greater importance as we adjust to life following Covid-19. This is why we are launching a systemic review on the coherence of poverty statistics in Autumn 2020.

We will provide more information on the scope of the systemic review on our website later this year and we look forward to engaging with the public to understand how the quality and public value of official statistics on poverty can be improved, to help facilitate open and fair public debate.

The fact that there are different ways of measuring poverty should help build the bigger picture on poverty in the UK and should not be used as an excuse to be selective with data to support only part of the story. This is something the Chair of the UK Statistics Authority commented on back in 2017, when referring to the then Prime Minister’s comments on child poverty:

We do, however, feel that public debate would be enhanced if the Government indicated more clearly which measure or measures it places greatest weight on and that it was consistent in reporting progress against this measure. It is unhelpful if there is regular switching between what constitutes the key measure.”

Measuring poverty is complicated. There is no wrong measure but there is a wrong way of using the available measures – and that is to pick and choose which statistics to use based on what best suits the argument you happen to be making. It is important to look at all the data available and set the context when referring to statistics on poverty.

The benefits of collaboration: working together to improve the evidence base on deprivation

How statisticians in the four nations are working together to improve the evidence base on deprivation

Deprivation is a complex concept. The term is often used interchangeably with poverty (which relates to a lack of income to meet basic needs) when in fact deprivation refers to a serious lack of something which is considered to be a basic necessity in society. From healthcare to housing, there are multiple factors which determine how deprived an area is. In recent weeks, deprivation has hit the headlines in relation to the COVID-19 pandemic. Analysis published by the Office for National Statistics found that people living in more deprived areas have continued to experience COVID-19 mortality rates more than double those living in less deprived areas.

It therefore remains crucial that data are made available to identify the most disadvantaged areas and to build the evidence base on the different facets of deprivation. The indices of multiple deprivation are an important tool for achieving this and for supporting decisions about addressing local needs. They are a relative measure which look at how deprived different areas are compared to one another. This means an area may see improvements in absolute terms (such as increased job prospects) but still fall in the overall rankings if other areas have also experienced improvements. The indices are widely used by central and local government and community organisations to target their services.

Today we released a series of letters about our review of the indices of multiple deprivation produced by the Ministry of Housing, Communities and Local Government (MHCLG) , the Welsh Government and the Scottish Government . We didn’t review the statistics produced by the Northern Ireland Statistics and Research Agency (NISRA ) as these are produced to a different time scale.

Our review identified some real strengths and opportunities in the way the statistics teams have worked together to improve the public value of the statistics. They all spoke positively about being part of a ‘four nations group’ which works collaboratively to make guidance and presentation across the deprivation statistics more consistent. There were two areas in particular that we feel have benefited from this joined up working.


Putting users first

One thing that became clear in our conversations with each of the teams is that they have a good understanding of the uses and users of their respective statistics. The statistics are relied upon for local decision making and interventions, which is something the statisticians are keen to prioritise in the development of the indices.

As part of its regular meetings, the four nations keep each other updated on emerging areas of user interest and reoccurring queries from the public to remain alert to developments in this field. Even the frequency of the statistics is determined by user need. We discovered that it can be a burden on local authorities and third sector organisations who use the statistics in their own analyses if the indices are updated too regularly – particularly where changes between years are slow moving. Similarly, users are at the heart of any methodological changes to the construction of the indices between iterations – these are carefully considered and reviewed by domain experts and key user groups.


Bringing the data to life

There has been a collective effort by the teams to demonstrate the relevance of the statistics to users and help them understand the complexity of deprivation. From interactive maps, to pen pictures, to case studies, the producers have tailored their outputs to bring out the key messages whilst also offering the flexibility to delve deeper into the data. For example, MHCLG has recently published a new mapping tool which allows users to visualise the statistics at new geographical levels including Westminster Parliamentary Constituencies and Travel to Work areas.

The Welsh Government and Scottish Government also publish their own interactive tools. Alongside this, we found the Scottish Government’s analysis of deep-rooted deprivation (areas that have remained the most deprived in previous iterations of the index) is an innovative way of bringing out insight from the statistics whilst addressing the limitations of the statistics in a way which can be understood by all. We were pleased to see that the Welsh Government took inspiration from this and has also carried out analysis of deep-rooted deprivation in Wales. The team in MHCLG has welcomed our recommendation to agree and adopt a common definition of deep-rooted deprivation with the Welsh and Scottish Governments, to further improve harmonisation and consistency across the indices of multiple deprivation.

To summarise, the indices of multiple deprivation are a fascinating set of statistics which have benefited from collaboration between the statistics teams in the four nations. The statistics continue to be relevant to a wide range of users and the teams’ collective approach to putting users at the centre of the statistics presents further opportunities for developing the public value of the statistics going forward. We look forward to seeing these opportunities realised in the future.

Closing data gaps: understanding the impact of Covid-19 on income

In recent weeks, you may have spoken with friends and family who’ve seen their income and living standards impacted in some way by COVID-19. They may have been furloughed and are concerned about whether they will have a job to return to or perhaps they have experienced a reduction in business if they are self-employed. Maybe your own household is receiving less income and you are struggling to juggle household costs with home schooling.

Despite the UK starting to ease the lockdown measures it introduced in response to COVID-19, the impact of this pandemic on the labour market and people’s livelihoods is expected to continue for some time. We are already seeing signs of the scale of the impact on the labour market; from vacancies at a record low in May to new claims to Universal Credit passing 2.5 million between March and June. The Office for National Statistics (ONS) recently brought forward the launch of its online Labour Market Survey to help provide the necessary insight into the impact of COVID-19 on people’s employment and working patterns.

There is a range of data which can help us understand how jobs and employment have been affected but we need better data on income and earnings to fully understand the narrative of how people’s livelihoods and living standards are being affected by the pandemic. A recent Opinions and Lifestyle Survey by the ONS found that half of the self-employed reported a loss of household income, compared with 22% of employees, in the month of April. Last year, we wrote to the ONS, Department for Work and Pensions and HMRC to restate the importance of delivering the insights identified in our work on the Coherence and Accessibility of Official Statistics on Income and Earnings. Whilst some progress has been made since our findings were published in 2014, it has been slow to date and more work needs to be done to help users understand the dynamics of the labour market and to address key data gaps in relation to income and earnings.

We have recently carried out work to look at examples of data gaps being addressed in the statistical system. Our work found three common themes in successful cases of solving data gaps: sufficient resource (whether new or restructured), high user demand and strong statistical leadership. The combination of new user demand for information on income and earnings that has emerged from COVID-19, restructured resource that has been put in place to respond to this demand, and the potential for statistical leadership to shine, could be the catalyst for solving these data gaps.

Improving the storytelling of income and earnings and addressing the data gaps identified by OSR could help users better understand the lived experience of households and different employment types throughout the pandemic. These are difficult times for many people from all walks of life and people are facing lots of unknowns. It is important that we can understand the true scale of the impact so that when the UK begins its recovery from the pandemic, support can be targeted effectively towards the groups most severely affected. There are two areas in particular in which solving data gaps could improve our understanding of COVID-19.

 Household level data is not keeping pace with individuals

Household measures of income and earnings have traditionally been less timely than measures for individuals and this formed a key area of our findings in the work highlighted above. With respect to COVID-19, there is interest in understanding how the Government’s income support measures have impacted income for different household types such as those with children or lone parent households. Even in households which are not receiving any income support, people may have had to adapt their working patterns to share the responsibility of childcare which may lead to one or both of the earners in a household working reduced hours on potentially reduced pay. HMRC has published data which shows that 9.1 million jobs had been furloughed by mid-June but we won’t see any contextual data about the impact on households until 2022 in the Family Resources Survey. We hope the relevant statistical teams explore new ways to deliver this insight in the meantime.

 There are lots we don’t know about the world of the self-employed and business owners

It is notoriously difficult to capture information on the income and earnings of the self-employed or those who own businesses. This is because many earn less that the taxable allowance so are not captured in statistics relating to income tax and many don’t have predictable earnings so we don’t know what they’ll earn until well after the year end. The surveys which do manage to collect information on the self-employed are less timely than those for employees. When the Chancellor announced the Self-Employment Income Support Scheme, it quickly emerged that more people would need the support than originally anticipated and that the eligibility criteria would need to be adjusted to reflect the various ways that the self-employed can pay themselves. Improving the timeliness and completeness of information on the income of the self-employed could help identify groups of individuals who currently fall through the gaps of eligibility for the income support schemes in place.