The trouble with measuring poverty

We have since published a Review of Income-based poverty statistics from the time of this blog’s release.

What does it mean to be in poverty? It’s a question that has been debated for a long time and is one of the reasons why measuring poverty is so difficult. There are many interest groups and think tanks who have covered this issue time and time again, such as the Joseph Rowntree Foundation and Full Fact.

The concept of poverty means different things to different people and to some extent, requires a judgement call to be made as to where to draw the poverty line. Generally speaking, being in poverty refers to when people lack financial resources to afford to meet their basic needs.

While it may be difficult to define, it is important for central and local governments to understand the prevalence and nature of poverty in the areas they serve so that they can put targeted support in place. This blog looks at what data is out there to measure poverty and highlights the work being done to improve the future evidence base on poverty.

So what is the best measure of poverty?

There is no right or wrong measure of poverty. Different measures of poverty capture different things, and trends in these measures can vary over time.

No single figure about poverty tells the whole story so context is really important when drawing comparisons of poverty over time.

There are four commonly used income-based measures of poverty produced annually by the Department for Work and Pensions (DWP) in its Households Below Average Income (HBAI) National Statistics publication:

  • Relative poverty (relative low income) – households which have less than 60% of contemporary median income
  • Absolute poverty (absolute low income) – households which have less than 60% of the median income in 2010/11 held constant in real terms
  • Both relative and absolute poverty can be measured on a before housing costs (BHC) or after housing costs (AHC) basis.

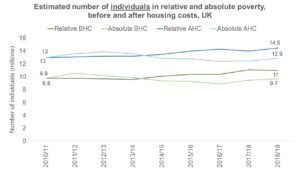
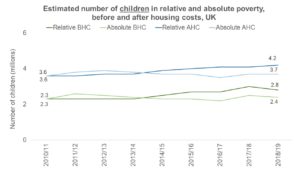
These four measures are published by children, pensioners, working-age adults and all individuals. The data below shows the latest figures for children and all individuals. Across all measures, we can see that the number of children in poverty has increased since 2010/11. For all individuals in poverty, the picture is more complicated as the total number in absolute poverty has seen a decrease in this time (by 100,000 individuals both before and after housing costs) whilst the number of individuals in relative poverty has seen an increase (from 9.8 million to 11 million before housing costs and from 13 million to 14.5 after housing costs).

Chart showing the estimated number of children in relative and absolute poverty, before and after housing costs, UK

Source: DWP Households below average income, 1994/95 to 2018/19

Chart showing the estimated number of individuals in relative and absolute poverty, before and after housing costs, UK

Source: DWP Households below average income, 1994/95 to 2018/19

As well as these four measures, DWP produces statistics on material deprivation. This is where an individual or household can’t afford certain necessities and activities that are measured by a basket of goods.

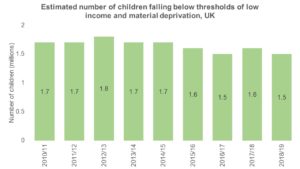
The DWP publishes estimates of the number of children falling below thresholds of low income and material deprivation in its HBAI statistics. The questions underpinning this measure were updated in 2010/11 and the DWP is clear that figures from the old and new suite of questions are not comparable. Since 2010/11, the number of children falling below thresholds of low income and material deprivation has fallen by 200,000.

Chart showing the estimated number of children falling below thresholds of low income and material deprivation, UK

Source: DWP Households below average income, 1994/95 to 2018/19

Material deprivation on its own is not widely used as a measure of poverty as it is not designed to measure low income. However, the combined measure of low income and material deprivation offers a wider measure of people’s living standards which can be used to look at elements of persistent poverty. This measure was the basis of one of the targets set in the Child Poverty Act 2010 aimed at reducing child poverty.

Outside the world of official statistics, there is another measure of poverty produced by the Social Metrics Commission (SMC). The SMC is an independent group of experts formed to develop a new approach to poverty measurement that both better reflects the nature and experiences of poverty that different families in the UK have, and can be used to build a consensus around poverty measurement and action in the UK.

It has been publishing its poverty measure since 2018 which is considered to be the most comprehensive measure of poverty available as it covers the depth, persistence and lived experience of poverty.

What more can be done to improve the evidence base on poverty?

The SMC has been working with the DWP to publish experimental statistics in 2020 that will look to take the current SMC measure and assess whether and how this can be developed and improved further to increase the value of these statistics to the public.

These experimental statistics will be published in addition to the HBAI publication, which will continue to produce the four recognised income-based measures of poverty highlighted earlier. The work on developing these statistics has been paused due to the Covid-19 pandemic but the DWP remains committed to carrying out this work.

Poverty remains a significant issue for the UK and has the potential to be of greater importance as we adjust to life following Covid-19. This is why we are launching a systemic review on the coherence of poverty statistics in Autumn 2020.

We will provide more information on the scope of the systemic review on our website later this year and we look forward to engaging with the public to understand how the quality and public value of official statistics on poverty can be improved, to help facilitate open and fair public debate.

The fact that there are different ways of measuring poverty should help build the bigger picture on poverty in the UK and should not be used as an excuse to be selective with data to support only part of the story. This is something the Chair of the UK Statistics Authority commented on back in 2017, when referring to the then Prime Minister’s comments on child poverty:

We do, however, feel that public debate would be enhanced if the Government indicated more clearly which measure or measures it places greatest weight on and that it was consistent in reporting progress against this measure. It is unhelpful if there is regular switching between what constitutes the key measure.”

Measuring poverty is complicated. There is no wrong measure but there is a wrong way of using the available measures – and that is to pick and choose which statistics to use based on what best suits the argument you happen to be making. It is important to look at all the data available and set the context when referring to statistics on poverty.

Think of the children

The Covid-19 pandemic is having a profound impact on all parts of society.  While statistically those medically hardest hit by the disease are the older generations, children and young people are having to come to terms with significant, immediate and possibly long term changes to their lives.

More than ever it is important that statistics about children and young people reflect the lived experiences of children. Statisticians play a key role in ensuring that the data collected and published about children and young people accurately reflects their needs and helps to inform policy and services that work to support them.

Our review

Prior to the pandemic we started reviewing the availability of statistics about children and young people with a view to better understanding their value in society and to determine whether:

  • the current statistics are accessible, timely and help society to understand the experiences of children and young people in all aspects of their lives
  • improvements are needed to the ways in which decisions on what to collect and analyse are reached
  • the wider statistical system is responsive to the needs of users of statistics.

We want to see a step change in how the needs of children and young people are met by official statistics, where statistics producers consistently consider children and young people’s needs and voice during the design, collection, analysis and dissemination of statistics. The current pandemic and its aftermath make this all the more important.

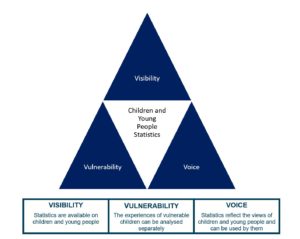
Our initial research has looked at the strengths and weakness of the current statistics on children and young people. In doing so, we have identified three key lenses which, if applied through a structured framework, may support statistic producers to better meet users needs. This approach reflects the core principles set out in the UN Convention on the Rights of the Child.

Our proposed framework

We propose that producers of statistics consider children and young people through three lenses.

  • Visibility – Statistics are available on children and young people
  • Vulnerability – The experiences of vulnerable children can be analysed separately
  • Voice – Statistics reflect the views of children and young people and can be used by them

Children and Young People Statistics. The three lenses: Visibility. Vulnerability. Voice.

For each lens of the framework we propose some key questions for statistics producers to consider.

Visibility – Statistics are available on children and young people

  • Are children and young people visible in the statistics?
  • Is data collected about them and then made available to inform decisions in the best interests of the child?
  • Are decisions around what data to collect on and from children and young people transparent?

Vulnerability – The experiences of vulnerable children can be analysed separately

  • Are the most vulnerable children visible?
  • Is their experience identifiable to ensure that they are not being discriminated against?
  • Do the statistics and data help identify which groups of children and young people are the most vulnerable to having poorer outcomes?

Voice – Statistics reflect the views of children and young people and can be used by them

  • Are the views of children and young people represented in the statistics?
  • Are survey questions asked to children and young people themselves?
  • Do the statistics give them a voice on what is important to them by being understandable to them?

Your views are important to us

The next stage of our review is to test this framework approach with a wider set of users and statistics producers to see if this supports these aspirations. We hope also that sharing our initial thinking now may assist producers in their immediate decisions about what statistics and data they should be collecting and making available during and after the Covid-19 pandemic.

Are you a statistician trying to identify what data to collect and publish?  Would this framework help you in making those decisions? Is there anything else that you feel could be considered? What would be the barriers to ensuring that children and young people are visible in the statistics, that the vulnerable can be separately analysed and that the statistics give children and young people a voice?

Are you a decision or policy maker using statistics to understand the lives of children and young people and the impact of decisions and policies on them? Does this framework cover the key elements that you feel are important?  Is there anything else that you think statisticians should consider?

Are you a researcher using data and statistics to research children and young people’s lives and outcomes and the interventions that impact on them? Does this framework cover the key elements that you feel are important?  Is there anything else that you think statisticians should consider? Are your needs adequately reflected by the framework?

Are you a child or young person or do you represent them? Are visibility, vulnerability and voice the key elements of statistics that are important to you? What are you most interested in when looking for statistics? What makes it difficult for you to find and use statistics?

Please get in touch to share your thoughts with us at regulation@statistics.gov.uk

Overcoming barriers to change

I work in the Children, Education and Skills domain in the Office for Statistics Regulation (OSR), not long after I joined OSR a colleague working with me in this area suggested we carry out a review of innovation and improvement. This was prompted because we were starting to hear about some interesting developments in these statistics. Our aim was to find out more about the great work going on in producer teams across the UK to comply with the new innovation principle in the refreshed Code of Practice for Statistics. Ultimately, we thought this would be a practical way we could encourage others along the journey of improving their statistics to meet user needs.

I have personally learned a lot along the way, both about the statistics in this area and about being more innovative. In our previous posts we have explored the importance of collaboration, and shared some ideas to think about when producing alternatives to traditional pdf statistics releases.

However, my previous experience working in the Government Statistics Service (GSS) meant that I wasn’t surprised to hear that it hasn’t all been plain sailing. I hope some of the suggestions we’ve picked up during this review might help you to overcome some of the challenges you face when innovating in the development and presentation of statistics.

Making the time

Producers told us time and resource were barriers they faced to implementing change and yet we heard some great examples of how this is being tackled. We heard about how teams have broken down larger scale improvement projects into manageable chunks to tackle at quieter times of the production process, and about how producers are working across Departmental barriers to share resource. We heard about statisticians working with operational researchers, IT professionals and others in their organisation with an interest in coding to develop outputs together. We also heard examples of different departments sharing coding skills via the Government Data Science Slack group, and about teams getting together with those in other Departments to share lessons learned. All of this helps build capability and share knowledge, as well as saving time.

Getting your innovations out there

We heard that once producers have freed-up the resource and developed the skills to produce alternative outputs such as dashboards and interactive displays of statistics, there can be big hurdles to getting outputs into the public domain. This is often because of the Government Digital Services (GDS) restrictions on the type of content that can be hosted on GOV.UK and the restriction to the development of alternatives to GOV.UK.  At OSR, we recognise that while GDS restrictions are in place for good reasons, they can be a barrier to innovation in the presentation and dissemination of statistics

We’ve found some teams have worked with GDS to publish experimental tools, for example, to collect evidence of user needs for their new outputs. If you, like many teams we heard from, need support or advice on developing alternative dissemination platforms to host interactive content, you could contact the Chair of Presentation and Dissemination Committee’s Web Dissemination sub-group, John.Wilkins@dft.gov.uk. We will also look at ways OSR can further support this work.

Meeting user needs

As part of the review, we spoke to users of some of the statistics to find out how the changes had impacted them. When users had been involved in the developments, they were usually full of praise for the changes. However, in some cases the users weren’t aware of the projects, and didn’t understand why outputs had changed. We noticed there was often no public statement or easily accessible information about the plans, the aims or timescale of the innovation project.

A transparent approach would keep users up to date with planned changes and allows producers to share information of any likely impact on the statistics – such as how a change in methodology or data collection may affect the quality or consistency of the statistics – and what steps are being taken by producers to address these. It would also open the door to wider user feedback and input in the development stages of an improvement project. Thinking more about how you tell users about changes and developments may help with Code compliance, but more importantly, it is likely to help you to make the most of the opportunity to improve your statistics.

Get in touch

At OSR we are keen that we support producers to understand the requirements of the Code and we hope this series of blogs and articles will go some way to seeing what the new Innovation and Improvement principle means in practice. We also hope it has given you an idea of the types of good practice we might hope to see when assessing statistics. While this is the last planned web piece for this review, we are keen to explore further with the GSS Good Practice Team other ways to share the things we learned. We are also keen to hear about other innovations going on in the GSS to incorporate as case studies in the interactive version of the Code of Practice, so please do get in touch if you are doing anything interesting.

I’d like to thank all the producers who we spoke to during this review, it was exciting to see the range of activities producers were undertaking and their commitment to improvement was admirable.

Louisa