Findings
Data sources and methods
ONS should work with data suppliers to better understand the quality of source data
2.1 The GOS statistics team acknowledged that it needs additional methodological expertise, having experienced a loss of expertise in recent years. The team didn’t fully reassure us that it had a comprehensive understanding of the data sources or methods used to produce the Profitability or GOS estimates or whether the adjustments that are applied are still fit for purpose. For example, the team was unable to demonstrate to us an understanding of how the adjustments it makes to HMRC GTP data contributed to improving the quality of annual GOS statistics. ONS uses many data sources to make adjustments on the way to producing the annual GOS estimates and needs to be able to explain clearly to users the reasons for the adjustments. For some non-ONS sourced data, such as data from the Bank of England on interest paid on loans and bonds, it is not clear to ONS how the data are used in the estimates of GOS. We also found that Supply and Use table adjustments (which aim to reconcile the differences between the three approaches of estimating GDP: production, income and expenditure) to GOS are mainly negative, which may suggest a bias in these estimates.
2.2 ONS has conducted various reviews, for example in 2018, to better understand the adjustments it applied to HMRC data and the potential use of VAT data as a more-timely indicator of quarterly GOS. In 2020 the ONS Data Science Campus (DSC) reviewed whether this data could be used to estimate GOS. ONS told us that the DSC review found that an alternative method using HMRC tax data was unworkable due to concerns including timeliness, reproducibility and quality. ONS told us that there was no written report and that the findings were not officially recorded.
2.3 The GOS statistics team was not aware of the findings from the DSC review and was also unable to demonstrate to us an understanding of HMRC GTP data, for example, the impact that tax relief might have on GTP. HMRC informed us that the data it sends to ONS is mainly consistent with its Corporation Tax statistics commentary, the only differences being that it removes financial companies and public sector corporations (approximated based on ONS data) and it supplies figures aggregated by company account periods ending on a calendar year basis, rather than on a financial year basis.
2.4 The HMRC corporation tax liabilities and data analysis team highlighted to us that recent methodological changes to company industrial allocations in annual corporation taxation data may result in revising the 2023 data. From 2023 onwards HMRC has switched from using the ONS Inter-Departmental Business Register (IDBR) to Companies House Free Data Product (FDP) as its preferred matching tool and IDBR has now only been used where no match exists within the FDP. During a review of the methodology, HMRC analysis found “the FDP to be a more reliable source as it matches the declaration of SIC [Standard Industrial Classification] by the company to Companies House (which is publicly available) for the reporting year. The IDBR can sometimes indicate the SIC of the parent company for those companies within groups; this is due to the slightly different reporting units used within the IDBR”.
2.5 HMRC told us that it is willing to run a workshop for ONS to explain how the data it estimates on GTP is compiled before it is delivered to ONS. More widely, HMRC is also willing to work with ONS on other data quality issues for example, providing a more accurate list of public corporations for the next update it sends to ONS. During this review, ONS contacted HMRC to discuss how HMRC adjusts GTP and to discuss the treatment of public corporations.
2.6 Additionally, users we spoke to were not sure what sources were used in the production of the statistics, nor the adjustments that were carried out. This has led to some users questioning the quality of the statistics. To reassure users and provide a robust explanation of the quality of the statistics, ONS needs to better understand the data sources, particularly those supplied by HMRC, which accounts for most of the GOS estimate.
Quality assurance
Quality assurance processes are well-established but would benefit from more-comprehensive assurance of its data sources
2.7 The GOS statistics team does not have regular or direct contact with its other non-ONS data suppliers and does not carry out any quality assurance of administrative data that feed into GOS estimates, largely due to resourcing constraints. For example, when producing estimates of Profitability for continental and non-continental shelf companies, ONS downloads data directly from website sources DESNZ and National Grid. Without having regular or direct contact with these data suppliers, the GOS statistics team has little information on how these data sources are compiled, what if any adjustments are made and what quality assurance takes place before the data are used to produce the statistics. For example, as a supplier of data for GOS estimates HMRC told us that a lot of quality assurance is carried out on its corporation profits data before they are supplied to ONS. With a lack of information about the quality of data sources, it is difficult for the GOS statistics team to make a judgment on the quality of data sources. If the team had a more comprehensive understanding of the data sources and methods used to produce the estimates, it would help it better communicate the quality of the statistics to users.
2.8 Suppliers of data, such as HMRC and the Bank of England, suggested ONS could be more transparent about its uses of their data. This would give data suppliers a better understanding of what ONS needs for the data and ensure the data they supply is fit for purpose. The Bank told us that it has an ongoing project analysing Profitability data from private databases which use information from Companies House; ORBIS, FAME and Capital IQ. It has the resources to build a database that includes these data and would be willing to collaborate with ONS to support it in developing more timely Profitability estimates.
2.9 ONS’s quality reviews provide an assessment of the quality of its statistical outputs against eight quality dimensions: sources; methods; data; systems; processes; quality; users and reputation; and people. ONS carried out a quality review of Profitability and GOS statistics in 2022. The quality review highlighted whilst there is good communication with data suppliers operating within the same division as the statistics production team, it needs to “work on getting open communication channels to ensure that it is aware of any issues with the quality of source data”. Several data suppliers we spoke to were not fully aware of the source of the data or that their outputs were used by the GOS team. Information about how the quality of the data inputs is assured and what additional processing or adjustments have been made to the data inputs should be shared transparently and coherently with all users, but several of the data suppliers were unsure how to find this information. For example, estimates on implicit fees (which are an adjustment applied to the HMRC data) are used by the GOS statistics team. These estimates are sourced from ONS financial corporations’ non-monetary financial institutions team (via CORD) who did not know that the estimates were used to adjust GOS estimates. Additionally, the GOS statistics team did not know how implicit fees estimates were compiled or where they were originally sourced within the ONS. The estimates come from the financial sector accounts team, which compiles them from the ONS financial services survey. All three branches are part of ONS’s financial sector accounts and corporations’ division, yet they shared little information on who used the data and how they are compiled. We noted this scenario for several adjustments.
2.10 ONS highlighted that the main risks to the quality of Profitability and GOS outputs are missing data or calculation errors, which both arise during manually completed tasks or a calculation in CORD not working properly. The GOS statistics team mitigates these risks through quality assurance procedures and spot checks to ensure inputs are fully populated and free of errors. Missing data and unexpected changes can also be caused by other teams’ data or by the calculations producing errors. The GOS statistics team identifies what transaction or CORD function caused the issue and then flags this to the relevant teams so that they can investigate and correct mistakes in their input data if needed. In the case of CORD calculations not working properly, the team works with the technology support teams to resolve the issue. When problems occur, learning is shared across the statistical division via a log, which is updated monthly following discussions with ONS heads of statistical divisions.
2.11 The implementation of Reproducible Analytical Pipelines (RAP) principles could reduce the risk of human error, improve the quality of the analysis, create a more efficient statistical production process, and improve business continuity and knowledge management within ONS. Despite evidence of some RAP principles being used in the production of these statistics, we found that there are still a lot of manual quality assurance processes embedded in the current production systems. Production of the Profitability statistics, for example, involves a manually updated Excel spreadsheet to “tick off” each completed stage, with comments entered where errors or queries occur. Manual identity checks are also carried out in Excel, as part of the National Accounts compilation process, to ensure that the changes carried out have not resulted in any unexpected trend changes. Spot checks are performed at key stages of production before the data are allowed to proceed further. For example, checks for the quarterly GOS statistics are carried out on files imported into CORD and the output file that creates GOS. Other checks include making sure that non-seasonally adjusted figures equal seasonally adjusted ones at an annual level; quarterly data sum to annual; and that there are no missing data or unexpected negative figures. The GOS statistics team also checks if changes introduced during each Blue Book update result in the expected outputs for each change in scope and that the changes are within agreed tolerance limits.
2.12 As common in ONS National Accounts production there are no formal service level agreements between divisions; there is a mutual agreement between business areas to deliver data that is beneficial to all teams. Quality and methodology information, including metadata, are available alongside the data on CORD, but for statistics teams to get a full and up-to-date understanding of data quality the process relies on good engagement between business areas to supplement their knowledge and understanding of the data. Issues with the data supplied from other business areas are queried with the team supplying the data. Quality information is often explained by business areas informally by word of mouth or email. Additionally, ONS has “daily GDP scrums” which bring all the production areas together to raise any quality issues with data that are used when estimating GDP. Some business areas within ONS, such as Supply and Use balancing, provide briefings that explain the adjustments made to the data. However, in other cases, there is little communication between the business area and the statistics team responsible for producing the data. Communication between the production team and the data suppliers should be enhanced to avoid the risk of quality information not being passed on. For example, revisions can be identified from snapshots of data taken from CORD or statistics teams’ spreadsheets (held for audit trail purposes). However, processes are such that it is left up to the user of the data to be aware that the data have been revised rather than the supplier making users aware.
2.13 Communication about the quality of the statistics, for example, methods changes that impact previous years and result in revisions, are conveyed by “curiosity sessions” – where statistics teams present their latest estimates along with contextual and quality information. The contextual and quality information provided at these sessions is later added into CORD. Attendees to curiosity sessions are usually key users or suppliers of data, who can query the results via question-and-answer sessions. For example, GDP curiosity sessions cover GOS data and are well attended. However, we found from our discussions with key GOS data suppliers that other curiosity sessions were not always well attended, largely because ONS statistics teams were not aware of who their key users were, so did not invite them. For example, the non-financial assets production team that supplies data used to compile GOS, holds curiosity meetings about the data, which the GOS statistics team is not invited to. Instead, the GOS statistics team takes the data from CORD, without a good understanding of the sources or methods used to produce the estimates. Attending curiosity sessions is not always necessary as quality information should be stored alongside the data in CORD, but it depends on teams knowing where the information is held and how recently the information has been updated.
2.14 As GOS is an important income component, when compiling GDP, the GOS statistics team has a close working relationship with the central GDP compilation team which it consults before the publication of the quarterly GOS estimates. Both teams discuss the GOS estimates relative to the compensation of employees estimates to produce GDP income estimates and how they compare with GDP expenditure and GDP output estimates. Discussions are held throughout the process to ensure the quality of the data, particularly on advising the split between manufacturing and services and how GOS should be allocated across sectors.
Requirement 1:
To improve the quality of the statistics, ONS should ensure that it has a good understanding of the quality of the data used to produce the statistics and focus on establishing good relationships with data suppliers. ONS should use our Quality Assurance of Administrative Data (QAAD) guidance to help with its understanding of the data sources and methods used to produce the statistics. To reassure users on the quality of the statistics, ONS should communicate to users its findings on the quality of the data sources and publish these.
Resources – statistical production processes
ONS statistics production processes should facilitate better interaction between data suppliers
2.15 Overall, the statistical production system for Profitability and GOS estimates works well. Different statistical production teams share data, meaning that teams do not duplicate or reproduce statistics that are already available. This also ensures coherence between ONS outputs, and data suppliers can provide additional rounds of quality assurance.
2.16 We found that the production process doesn’t facilitate sufficient interaction between suppliers and end users of the data. The very nature of a centralised system means that there are often several layers of data suppliers between the statistics producer and the source for the data, resulting in data suppliers having little contact with users of their data. ONS should ensure sufficient interaction with data suppliers to demonstrate a good understanding of the quality assurance process when compiling estimates of GOS.
2.17 The statistical production process also means that ONS statistics production teams rely on other ONS data supplier teams to finalise their estimates. For example, the non-financial assets production team (which supplies data used to compile GOS estimates) told us that preliminary estimates it delivers to the GOS statistics team don’t include all of the quality adjustments, which account for 1-4% of the size of the final data it delivers.
2.18 Some ONS suppliers of data used to compile GOS, such as the non-financial assets production and the central GDP compilation teams, told us that CORD could sometimes produce unexpected results, due to missing data or incorrect parameters being applied. This resulted in ONS statistical production teams having to spend significant time examining the data to find the cause of the issue. These delays often resulted in limiting the time available for carrying out quality assurance checks before statistics were delivered to internal users and before being published.
2.19 ONS told us that it has not encountered any issues with the quality of Profitability and GOS statistical outputs as a result of the statistical production system. ONS’s 2022 quality review found that the current system was fit for its current purpose but highlighted concerns that the system may lack the flexibility to accommodate any changes, such as incorporating new data sources and processes or changes in the needs of users (for example, Profitability sectoral breakdowns). The GOS statistical team told us it is keen to bring in technical expertise to review its current production processes. However, due to the centralised structure of the production processes, the team has limited influence or control in any development work. ONS told us development resources prioritise two types of development: fixing problems in business-as-usual processes, where statistics teams are expected to carry out minor continuous improvement within the team; and on major development projects. These are prioritised across ONS economic statistics, with the major development projects largely reflecting priorities for the ONS from the Spending Review.
Requirement 2:
As part of improving the quality assurance of the statistics, ONS should ensure that production processes facilitate sufficient interaction and information sharing on source data quality. ONS should review its production processes and identify how it can accommodate changes such as incorporating new data sources and processes or changes in users’ needs.
Quality documentation
ONS should explain to users the sources used, methods to adjust and quality assurance it carries out on the estimates
2.20 ONS should better communicate information about how the quality of data sources used in Profitability and GOS estimates are quality-assured so that users can be reassured that estimates have been through a rigorous process of checks. Users we spoke to were not aware of the sources used to compile Profitability and GOS estimates, the methodology used, any uncertainties in data, or the wide range of adjustments that were applied in producing the estimates. Users were also unaware that ONS now estimates quarterly GOS using information from the GDP Production measure, and that ONS had stopped using the QOPS survey. ONS told us it was announced at the time, but during our review, there was no notice linked from the bulletin or the QOPS QMI to tell users that the survey had been discontinued. Users previously had to visit the ONS business surveys page to find that the survey had been discontinued. Furthermore, there was no explanation to users as to what data source was used instead.
2.21 Information on the quality of the Profitability statistics is found in the Profitability of UK companies QMI. During our review, ONS updated the QMI to better reflect the data sources used to compile estimates of company profitability and to reflect that the QOPS survey has been discontinued. ONS also specifically highlighted the increased uncertainty in recent quarters. ONS has agreed to add additional important quality information to the QMI, for example:
-
- The adjustments that are carried out by both ONS and HMRC
- An assessment of the quality of the data sources, for example, explanations of any limitations of data sources and the extent to which they can be overcome
- The methodology used to compile the estimates
- Uncertainty and information about biases
2.22 Adding additional information on data sources to the QMI is a positive step. However, ONS should communicate quality issues and adjustments to users more transparently. For example, ONS provides more-detailed information (than available in the QMI report) about the quantity and quality of sources and adjustments it uses to estimate GOS, in the ESA2010 UK Gross National Income (GNI) Inventory. This information is delivered to the European Commission, as part of the quality assurance process used to determine the UK’s contribution to the EU Budget, although the UK has left the EU, the budgetary processes are not yet complete. Further quality information for website data sources is available, for example from DESNZ, but could be linked from (or referenced in) the QMI.
2.23 ONS’s 2022 quality review suggested that the Profitability output could be improved further by communicating the reasons why it can’t be compared to other similar outputs and adopting harmonised standards where they are available.
2.24 Many users take the estimates at face value without necessarily considering the quality of the estimates because they are produced by ONS. However, to uphold the principles of the Code of Practice for Statistics ONS needs to reassure users of the quality of the Profitability and GOS statistics. Users told us it was difficult to know how the GOS data was constructed, specifically, which quasi-corporations were included in GOS estimates, and how quasi-corporations are identified and separated from the self-employed. ONS should be able to respond with a robust understanding and explanation of the quality of the statistics. To produce the statistics to accredited official statistics standards, it is important for ONS to better document information about the sources, methods (used to produce) and the quality assurance (carried out on) Profitability and GOS estimates. ONS should be able to explain the strengths and limitations of the statistics in relation to the different uses outlined in paragraph 1.28.
2.25 During our review, ONS published annual GOS growth rates including and excluding balancing adjustments, 2006 to 2021, which is a positive first step in helping users make well-informed decisions when using GOS statistics. The Supply and Use balancing adjustments were important adjustments when compiling GOS estimates. Their aim is to reconcile the GOS estimates with other income, expenditure and production components when estimating GDP. The team told us that in some years balancing adjustments could significantly affect the GOS estimate. We found that for some years, most notably in 2006, 2007 and 2010, the balancing adjustments applied to annual GOS estimates after the annual Supply and Use exercise resulted in downward adjustments which accounted for 7-10% of the annual GOS estimate. From 2011 onwards, balancing adjustments applied to GOS estimates, have been smaller. To provide greater transparency to users, ONS should explain the role of these adjustments and their change in value over time. Figure 2 presents annual GOS growth rates including and excluding balancing adjustments, and shows the size of the adjustments.
Figure 2 – GOS growth rates including and excluding balancing adjustments
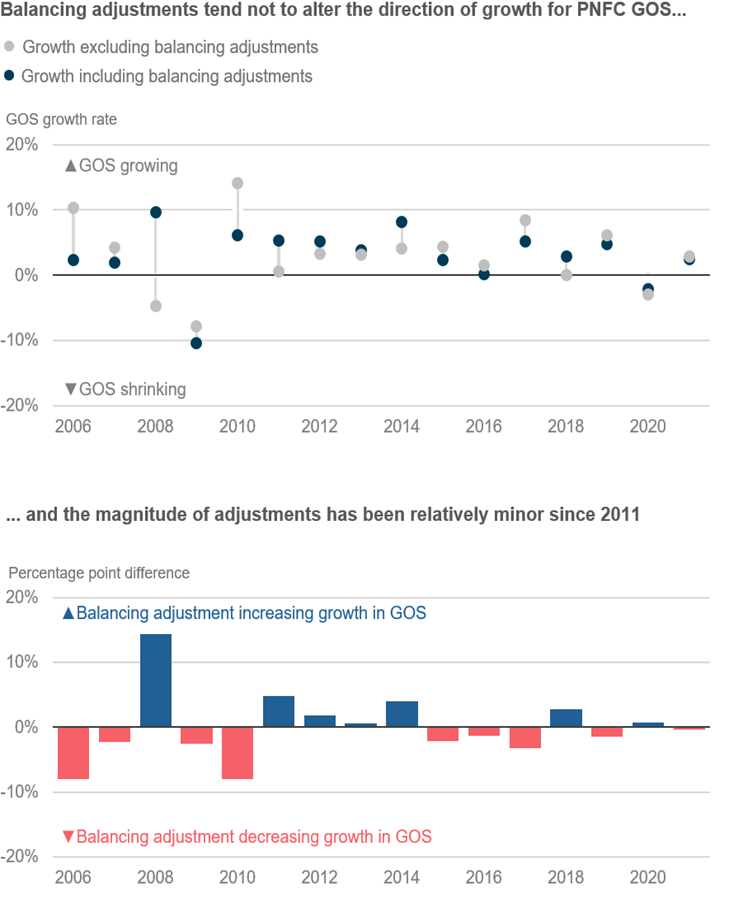
Source: Office for National Statistics: Gross Operating Surplus (GOS) and GOS growth rates including and excluding balancing adjustments, 2006 to 2021 – Office for National Statistics (ons.gov.uk)
2.26 Some users highlighted to us concerns around the size of the revisions that ONS is making to the GOS estimates. When analysing Mean Absolute Revisions (MAR) to quarterly GOS growth rates, we found that during both the pre-COVID and COVID period these were 2.3pp and 3.2pp respectively, 12 months after the first estimate. Figure 3 presents MAR for quarterly GOS growth rates. ONS should enhance its revisions analysis when presenting GOS statistics in two ways. Firstly, by taking into account what analysis users need to better understand revisions. Secondly, by enhancing its communication of the uncertainty in early GOS estimates following the guidance from OSR’s approaches to presenting uncertainty in the statistical system and the findings from the ESCOE project on communicating uncertainty in economic data. Further information on revisions of quarterly GOS growth rates can be found in Annex C.
Figure 3 – Mean absolute revisions of quarterly GOS growth rates
Source: ONS, GDP income components – revisions triangles – Private non-financial corporations gross operating surplus, 29 September 2023 (Pre-COVID period, 2010Q1-2019Q1. COVID period, 2020Q1-2022Q2).
2.27 Users also told us that ONS could better explain how it is revising the data to account for new government policies, for example, the Energy Price Guarantee (EPG), so that users can better understand the revisions that ONS has made. During our review, ONS has published information on the EPG in its classification review and refers to EPG in quarterly GDP bulletins. GDP bulletins.
Requirement 3:
To enable all users to make well-informed decisions on the use of Profitability and GOS statistics, ONS should better document quality information and communicate to users: the methods and data sources used; any limitations and uncertainties in the statistics; and quantification and explanation of revisions.
Resources – staff understanding of data sources and methods
ONS should ensure sufficient resource and support is made available so that staff have the opportunity to develop a strong understanding of the data sources, methods and systems used in the production of estimates
2.28 The independent review of UK economic statistics report in 2016 highlighted that ONS should be “…encouraging staff to: understand better how their statistics are used; be more curious and self-critical in identifying statistical issues; collaborate with users and experts; and create a culture of rewarding innovation”. The GOS statistics team recognised the importance of understanding the data sources and methods used to compile the estimates.
2.29 The GOS statistics team comprises three people, two of whom are quite new to the role. The team has worked enthusiastically to build its knowledge, for example, by engaging in curiosity sessions, but in-depth knowledge in the team has been lost as more-experienced staff have moved on. The combination of a relatively new team, coupled with resourcing pressures has meant that there are significant gaps in understanding the quality of source data and the system processes that are carried out to produce the statistics. ONS acknowledged the need to improve knowledge transfer and support business continuity with staff moves.
2.30 The GOS statistics team during this review updated the Profitability QMI, to explain the changes to methods, but this took longer than planned. This is mainly due to staff legitimately prioritising the production of the statistics, but partly due to staff not having a strong enough understanding of the quality and methods used to produce the statistics.
2.31 Users told us they would like to use more-granular data for Profitability statistics, beyond the services, manufacturing, continental and non-continental shelf breakdowns. The GOS statistics team said it would benefit from a review of its data sources and consider the use of more timely profitability data sources, such as company accounts or web-scraped data. ONS told us that development work is managed centrally as part of a wider National Accounts development plan and any major developments are subject to an audit process that considers user needs and the feasibility of developments within budgetary constraints. Information on development work more widely should be communicated more clearly, explaining how it meets users’ needs.
Requirement 4:
To reassure users on the quality of the statistics, ONS should demonstrate to users that staff have a strong understanding of data sources, methods, production processes and how the statistics align with users’ needs. In doing so, ONS should review its knowledge transfer process and support business continuity during staff changes, so ONS is reassured staff can respond confidently to users’ queries.
Meeting user's needs
ONS should engage with all key users to ensure the statistics meet their needs
2.32 The independent review of UK economic statistics report highlighted that the “primary objective of statistical producers is to meet user needs”. The needs of key users, such as the GDP compilation team, are considered throughout the statistical production process. More widely, the GOS statistical team records queries that it receives from users. Users who contributed to our review told us that the team (and ONS generally) helped respond to their queries and provide links to additional historical data that has been archived.
2.33 The GOS statistical team acknowledged that while there have been some attempts to formally engage with key users outside of ONS, more could be done. ONS’s 2022 quality review highlighted that the output met the basic needs of most users, but the review focused solely on ONS users. Outside ‘National Accounts’ wide external engagement with users, ONS has no recent feedback from users outside of ONS that could be used to guide any improvements to the statistics. The last reference of ONS formally reviewing the statistics against non-ONS user needs was in 2012. Since then, users have not been consulted on changes, for example, the decision by ONS in November 2023 to reduce the frequency of the Profitability release from quarterly to annual. The reason for the change to an annual release is to allow ONS to further develop the analysis of Profitability data.
2.34 It is essential that ONS develops a better understanding of user needs. The GOS statistics team was unaware, for example, of the vital importance of the quarterly GOS and Profitability statistics, to key users such as the Bank of England and OBR in feeding into monetary and fiscal policy decisions. At the time of this report, OBR told us that the timeliness of quarterly Profitability statistics was meeting its needs. However during this review, ONS announced changes to ONS’s publications and activities and whilst it plans to continue to publish quarterly GOS estimates and annual estimates of Profitability, ONS has discontinued the quarterly Profitability publication. When prioritising the publication and frequency of these statistics, ONS should ensure that it speaks with users of the statistics and ensure that any decisions reflect the majority of users’ needs.
2.35 The Bank of England, OBR and academics told us they needed better-quality estimates of the Profitability of UK companies and GOS, to enable them to improve analysis on the labour share and Profitability. Users also asked for more-granular industry breakdowns of these statistics, similar to those published in the Supply and Use tables and the Capital stocks and fixed capital consumption publication, produced by the ONS. Similarly, ONS supplies quarterly and annual estimates of GOS and mixed-income for the whole economy to the OECD providing more granular industry breakdowns, that users would benefit from. In the absence of more-granular industry breakdowns of companies’ profits, some users purchase Profitability data from private databases that use information from Companies House: ORBIS, FAME and Capital IQ.
2.36 There is an awareness from ONS that some users have demands for additional products that cannot be currently offered. ONS needs to be more transparent with users in explaining where it can or cannot meet user needs for more-granular industry breakdowns or more timely data sources to improve the quality of the statistics. For example, ONS’s 2022 quality review identified that the GOS statistics team would like to have more confidence in its industry splits for GOS. The lowest level of disaggregation for the Profitability of UK companies’ data is manufacturing and services. HMRC can supply data at the industry level, but ONS found that the quality of information was less robust as HMRC relies on businesses identifying their industrial classification code. ONS therefore instead uses the Annual Business Survey to identify the proportional split between manufacturing and services.