An army of armchair epidemiologists

Statistics Regulator, Emily Carless explores the work done to communicate data on Covid-19 publicly, from inside and outside the official statistics system, supporting an army of armchair epidemiologists. 

In 2020, our director Ed Humpherson blogged about the growing phenomenon of the armchair epidemiologist. Well, during the pandemic I became an armchair epidemiologist too. Or maybe a sofa statistical story seeker as I don’t have an armchair! Even though I lead our Children, Education and Skills domain rather than working on health statistics, I couldn’t help but pay close attention to the statistics and what they could tell me about the pandemic

At the micro-level I was looking at the dashboards on a near daily basis to understand the risks to myself, my family, my friends and my colleagues. I was watching the numbers of cases and hospitalisations avidly and looking at the rates in the local areas of importance to me. I felt anxious when the area where my step-sister lives was one of the first to go the new darkest colour shortly before Christmas 2021, particularly as my dad and step-mum would be visiting there soon afterwards. Earlier in the pandemic, once we were allowed to meet up, my mum and I had used these numbers to inform when we felt comfortable going for a walk together and when we felt it was better to stay away for a while to reduce the risk of transmission. These statistics were informing real world decisions for us.

At a macro-level I was also very interested in the stories the statistics were telling about the pandemic at a population level. The graphs on the dashboards were doing a great job of telling high level stories but I was also drawn to the wealth of additional analysis that was being produced by third parties on twitter. My feed was full of amazing visualisations that were providing additional insight beyond that which the statistical teams in official statistics producer organisations had the resources to produce.

As we highlighted in our recent State of the Statistical System report, the COVID-19 dashboard has remained a source of good practice. The dashboard won our Statistical Excellence in Trustworthiness, Quality and Value Award 2022. The ability for others to easily download the data from the COVID-19 dashboard to produce visualisations and bring further insight has been a key strength. I wanted to write this blog to further highlight the benefits of making data available for this type of re-use. I think Clare Griffith’s (lead for UK COVID-19 dashboard) tweet back in February sums it up perfectly. In response to one of the third-party twitter threads she said ‘Stonking use of dashboard data to add value. Shows what can be done by not trying to do everything ourselves but making open data available to everyone.’ 

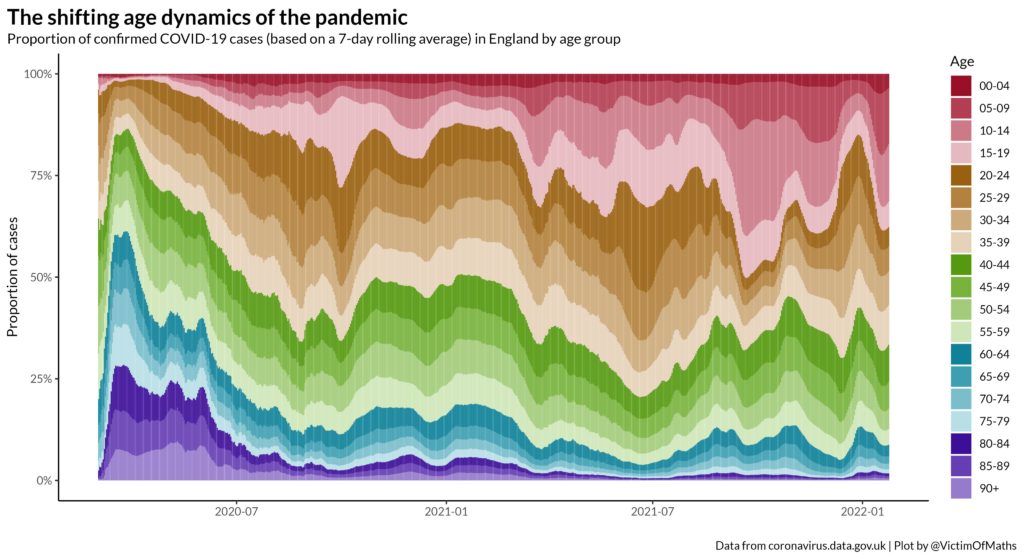
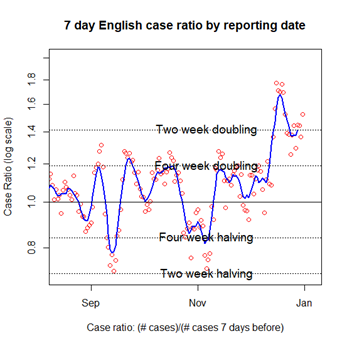
Here are a couple of my favourite visualisations (reproduced with permission). 

Like Clare, I really like Colin Angus’ (@VictimOfMaths) tapestry by age. It shows the proportion of confirmed Covid-19 cases in England by age group and how that changed during the pandemic. I also liked the way the twitter thread explained the stories within the data and that they made the code available for others. 

I also liked Oliver Johnson’s (@BristOliver) case ratio (logscale) plots. Although the concept behind them may have been complex, they told you what was happening with cases/ hospitalisations. The plot shows the 7-day English case ratio by reporting date on a log scale using horizontal lines to show where the case ratio showed a two or four week doubling or halving.

There was great work being done to communicate data on Covid-19 publicly from outside the official statistics system, supporting an army of armchair epidemiologists. This demonstrates the changing statistical landscape of increased commentary around official statistics, which we referenced in the latest State of the Statistical System report, at its best. Much of this was made possible by the Covid-19 dashboard team making the data available to download in an open format through an API with good explanations and engaging on social media to form a community around those data. We hope that this approach can be replicated in other topic areas to maximise the use of data for the public good.

Guest Blog: Challenges and Opportunities for Health and Care Statistics

The COVID-19 pandemic has thrust health and social care statistics into the headlines. Never has there been more scrutiny or spotlight on health statistics – they are widely quoted, in Number 10 briefings, in the news, across social media, on Have I Got News for you… and everyone (it seems) is an expert.  Nearly 2 years on from the first news reports of the ‘coronavirus’, the public appetite for data and statistics has continued to grow. This has created new challenges for health and care statistics producers, as well as highlighting existing areas for improvement, as set out in the recent Office for Statistics Regulation’s COVID-19 lessons learned report.  The report noted the remarkable work of statistics producers, working quickly and collaboratively to overcome new challenges.

I joined the Department of Health and Social Care early in the pandemic, first leading the Test & Trace analytical function and for the last year as the department’s Head of Profession for Statistics. I have experienced these challenges first-hand and have been impressed throughout by the professionalism and commitment of colleagues across the heath sector to produce high quality and trustworthy statistics and analysis.

One of the recommendations of the OSR report (lesson 7) calls for us to build on the statistical achievements of the last two years and ensure stronger analytical leadership and coordination of health and social care statistics. I reflected at the beginning of the pandemic that it was hard to achieve coherence, given the number of organisations in England working rapidly to publish new statistics. We have made substantial improvements as the pandemic has gone on, the COVID-19 dashboard one of many notable successes, but I want to go further, and apply this to other areas of health and social care.

To address this, I have convened a new Health Statistics Leadership Forum alongside statistical leaders in the Office for Health Improvement and Disparities, NHS England/Improvement, NHS Digital, NHS Business Services Authority, Office for National Statistics, and the newly formed UK Health Security Agency. The forum is chaired by the Department for Health and Social Care in its overarching role and brings together Heads of Profession for statistics and lead statisticians from across the health statistics system in England.

We will use this monthly forum to ensure collaboration across all our statistical work. And we have a broader and more ambitious aim to build a culture (that transcends the complex organisational landscape) which values analytical insights, supports innovation and ensures there is a clear, joined up narrative for health statistics in the public domain.

We have set five immediate priorities

  1. Coherence in delivery of advice and statistics
    We will work collaboratively to ensure that our statistical portfolios are aligned, and we provide complimentary statistical products – working in a joined-up way across the system
  2. Shared understanding of priorities
    Ensuring health statistics address the highest priority areas, are relevant and useful for public debate and provide clear insight to inform decision making at the highest level.
  3. Consistent approach to transparency
    We will ensure alignment of both our internal and external reporting so that the right data is quoted in statements and policy documents – clearly sourced and publicly available in line with the Code of Practice for Statistics.
  4. Shared methodologies and definitions
    We will have clear principles for coherence of methodologies and definitions, an expectation of common definitions where it makes sense to do so, and an escalation route via the forum for disagreement.
  5. Build a joined-up statistics community
    We will build a joined-up health statistics community through sharing our guidance on good practice, our approaches to induction, a shared seminar programme and annual town hall event, joint recruitment, managed moves, and secondments or loans.

Government statisticians have achieved so much as a community to provide statistics and analysis in really challenging times over the last two years, but there are lessons to learn and things we can do better.  I am confident that our Leadership Forum will ensure that we maintain this collaborative approach to delivery, and bring health statistical leaders together to make that happen.

Communicating data is more than just presenting the numbers

There has been a lot of talk about a UK Health Security Agency (UKHSA) technical report. It includes information on COVID-19 case rates in England for vaccinated and unvaccinated groups (Table 5). For some the immediate reaction to these data has been outright disbelief, others have used the data to support pre-existing, and incorrect, views that vaccines are not effective. Neither of these reactions is right. Understanding the issues properly is extremely complex, but what we do know with some certainty, is that while the vaccine will not stop the spread of the virus completely, it has been shown to help improve outcomes.

We have seen considerable improvements to the presentation of the data in the latest UKHSA report, which should support better interpretation of these data in future. However, it provides an important lesson about the harm that can be done if data are not clearly presented and well explained. There is more to communicating data than just presenting the numbers. Producers of data should do everything they can to minimise the potential for misinterpretation or misuse.

As well as presenting data clearly, producers need to guide users on how the data they publish can, and perhaps most importantly cannot, be used. They also need to explain the choices that are made in producing the analysis, along with the implications of these choices. Producers of data are the experts in the data they publish, their insight and understanding of these data can help ensure its appropriate interpretation and use.

To return to the example of COVID-19 case rates by vaccination status, the choices made by UKHSA have been a source of much debate because the consequences of the choices are so significant. It is important these choices and their implications are explained, and it is perhaps even more important that the guidance on interpretation of the data is clear. As an organisation of experts, UKHSA is in a position to help the public understand what the data mean, including explaining why the findings may not be as counter intuitive as they first appear while leaving no uncertainty around its views that vaccines are effective. UKHSA can help explain where there is value in using the data (e.g. looking at changes in case rates over time or across age bands, within the vaccinated group) and where there is not (e.g. understanding vaccine effectiveness).

Guidance on interpretation

The report is clear that a direct comparison of rates for vaccinated and unvaccinated is not appropriate. The report opens with the text:

These raw data should not be used to estimate vaccine effectiveness as the data does not take into account inherent biases present such as differences in risk, behaviour and testing in the vaccinated and unvaccinated populations.”

This is a helpful health warning. By thinking about questions people may have and how they may try to use data, producers can pre-empt potential issues and provide explanation that will support appropriate interpretation. In the context of COVID-19 case rates some of the key questions might be:

  • What are the data measuring? And is this what people want to know about? Many people want to know the risk of COVID-19 infection for those who are double vaccinated compared with those who have not had a vaccine. The data in UKHSA’s Table 5 do not do this. It does not show infection rates in the population. The table shows case rates i.e. the rate of COVID-19 positive tests in those who come forward for testing, something the government continues to ask people to do[1]. As a result, the data may have inherent biases.
  • Are the two groups in question comparable? It is easy to see that there may be different behaviours in people who have had two vaccinations compared to those who have had none. One hypothesis is that those with two vaccinations are more likely to get tested, meaning the case rates will look relatively higher for this group compared to the unvaccinated group. There will also be different risks associated with each group, the vaccination programme prioritised vulnerable groups and frontline health and social care workers, so includes those who are more at risk of infection. We haven’t seen evidence to quantify the impact of these risks and behaviours, but it’s likely there will be an impact.
  • Are there other sources of data which could be considered? There are increasingly other sources of information which demonstrate vaccines are highly effective. The UKHSA has done a significant amount of research and analysis into vaccines. This is outlined in the vaccine surveillance report, which sets out effectiveness against different outcomes (infection, symptomatic disease, hospitalisation and mortality). There is further information via UKHSA’s monitoring of the effectiveness of COVID-19 vaccination In addition, the Office for National Statistics (ONS) has published an article on the impact of vaccination on testing positive as well as an article on deaths involving COVID-19 by vaccination status. All of these examples take into account characteristics of those in the sample and try to adjust for differences. As a result, they offer a better indication of vaccine effectiveness.

Implications of choices

To undertake any analysis choices need to be made. These choices and their implications should be explained.

In the calculation of COVID-19 case rates the most significant choice is the decision on what population estimates to use to calculate the rates (“the denominator”). There are two obvious choices: the National Immunisation Management Service (NIMS) or the ONS mid-year population estimates. Each source has its strengths and limitations and we don’t yet know the true figure for the denominator.

In the context of case rates the choice of denominator becomes even more significant than when it is used for take up rates, because the numbers of people with no vaccine are low. The population of people vaccinated is relatively well known, NIMS includes all those who have been vaccinated and is a good estimate of this population.

The difficulty comes in understanding the total number of the population who have not had a vaccination. There are many advantages to using NIMS, not least because it is consistent with international approaches to considering immunisations and allows for analysis which would not be possible using aggregate population estimates. However, we also know that NIMS overestimates the population. Similarly, there are strengths in using ONS mid-year estimates, but we know these can have particular difficulties for small geographic breakdowns. We also know that the time lag created by using mid-year 2020 estimates has a disproportionate impact in older age groups – for example, it means that in more granular age bands some older age groups show more people having been vaccinated than the ONS population suggests exist. There is more information on the strengths and weaknesses of each source in NHSE&I’s notes on denominators for COVID-19 vaccination statistics. The chief statistician at Welsh Government has published a blog which outlines the impact of the different choices for vaccine uptake in Wales.

Looking just at the adult population, Figure 1 shows the different results which come from using the two different denominator options for the population who have never had a COVID-19 vaccine.


Figure 1: COVID-19 case rates per 100,000, England by age band
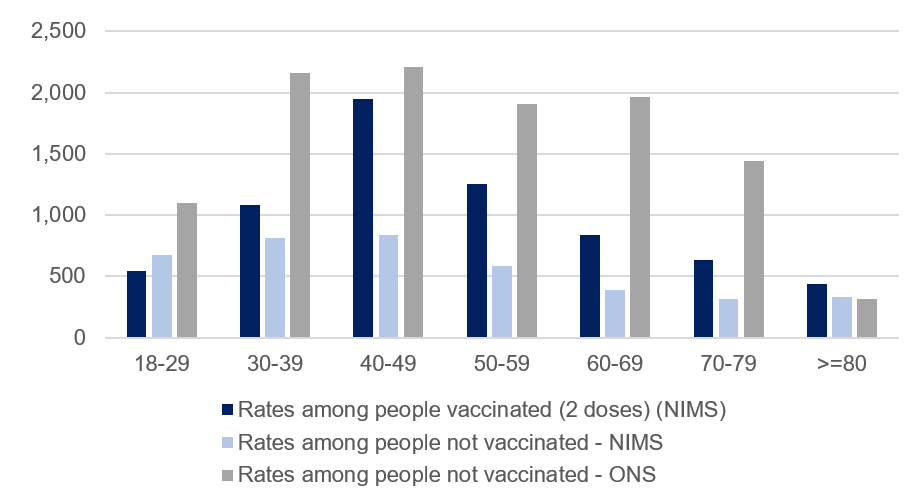
This table shows covid 19 case rates per 100,000 people in England by different age groups

*see notes at end for the data and more details of sources used in this figure.

Using the NIMS denominator, the positive case rates for those who are not vaccinated is below the case rate for those who are vaccinated (except in the 18-29 age band). Using the ONS mid-year 2020 estimates as a denominator, the positive case rates for those who are not vaccinated is higher than for those who are vaccinated (in all age groups below 80). While we don’t yet know the true figure for the unvaccinated population, this seemingly simple choice has a huge impact. It is particularly problematic in this circumstance because any error in the total population estimate is applied in its entirety to the unvaccinated population.

As an example, for the 70 to 79 population, the NIMS figure is just 4% higher than the ONS mid-year estimates (5.02 million and 4.82 million respectively). These figures can then be used in combination with the data on total people vaccinated from NIMS to estimate the total number of people not vaccinated. In doing this, the difference of nearly 200,000 in the total population estimates is applied entirely to the relatively small number of 70 to 79 year olds who are not vaccinated. It means the NIMS estimate for the unvaccinated population in the 70 to 79 age band is 363% higher than the estimate of those not vaccinated based on the ONS mid-year estimates. So, an estimate 4% higher at the 70 to 79 age band has led to an estimate 363% higher in the estimate of the unvaccinated population at that age band. This has a huge impact on the case rates for this group, and the conclusions drawn from the data.

An understanding of the impact of choices is essential in supporting appropriate interpretation of the data. In this scenario, we don’t have enough information to know the true figure for the unvaccinated population in each age group. We hope that the work UKHSA is doing to improve the NIMS data (including removing duplicates) along with the work ONS is doing on population estimates and the 2021 Census, will improve our understanding. It is really positive that ONS and UKHSA are working together to try and solve this issue, which is so important across so many statistics. Given this uncertainty, knowledge of the implications of the different choices can help users interpret the presented data with caution.

The message from all this is that data has huge value, but it is also really important that those publishing data consider how the data may be used, what the strengths and limitations of the data are and think about how to present data in a way that minimises the potential for misuse.

In time, there will be changes to what we know about the population, and producers of analysis should not shy away from updating their outputs when new evidence comes to light. In doing this, they should also clearly explain any changes and choices, as this transparency will support trust and understanding. It will help the good data shine out and ensure statistics serve the public good.

[1] https://www.nhs.uk/conditions/coronavirus-covid-19/testing/get-tested-for-coronavirus/


Data, sources and notes for case rate calculations:

Table 1: COVID-19 case rates per 100,000, England by age band

Age bandRates among people vaccinated (2 doses) (NIMS)Rates among people not vaccinated - NIMSRates among people not vaccinated - ONS
18-29546.0671.31089.9
30-391084.3816.52159.1
40-491945.2834.02207.1
50-591252.1585.51907.2
60-69837.6390.71964.7
70-79636.1311.81443.7
80 or over434.1334.1312.1
  1. The calculations in Figure 1 and Table 1 are based on publicly available data. There are slight variations compared to the UKHSA data in Tables 2 and 5. For example, it is not clear exactly what date UKHSA has used for total vaccinated or unvaccinated populations, and there are regular revisions to the published data on the coronavirus dashboard, which may have caused changes since data were used in the UKHSA analysis. These differences are not big enough to impact on the conclusions in this blog.


  1. NIMS data from coronavirus dashboard download, downloaded 31 October 2021. Metrics downloaded: “vaccinationsAgeDemographics”. Variables used:
  • Total population = VaccineRegisterPopulationByVaccinationDate (for 24 October)
  • Total vaccinated population = cumPeopleVaccinatedSecondDoseByVaccinationDate (for 10 October i.e. 14 days before end of period, as only cases with vaccination 14 days or more before positive test are included in UKHSA table of cases)
  • Total not vaccinated = Population estimate – cumPeopleVaccinatedFirstDoseByVaccinationDate


  1. Total number of cases by age, and, cases by vaccination status by age, taken from COVID-19 Vaccine surveillance report week 43. UKHSA report shows total cases for four weeks to 24 October 930,013. Data downloaded (31 October) from coronavirus dashboard for four weeks up to 24 October (inclusive) gives 935,386. Additional cases likely due to cases reported between UKHSA analysis and 31 October.


  1. ONS population estimates based on ONS 2020 mid-year estimates taken from NHSE&I weekly vaccine statistics, 28 October 2021 (downloaded 31 October).
OSR in the pandemic and beyond: Our year so far

The first half of 2021 has seen further lockdowns, an impressive vaccination rollout and as we ease into the Summer, some easing of restrictions across the UK. It’s also been a busy time for us, as we continue to push for the production of official statistics, and other forms of data, that serve the public good. We really feel that public good matters more than ever.

We recently published our business plan for 2021/22 in which we outline our focus for the statistical system over the coming year and how it can consolidate the huge gains made in data collection and publication. We have also made progress we have made on our role in data. Our review and findings for developing statistical models to award 2020 exam results may well be the most comprehensive review of the 2020 exam story. It’s comprehensive in two senses. It covers all four parts of the UK, unlike other reviews. And it goes beyond technical issues about algorithms to identify lessons for all public bodies that want to use statistical models in a way that supports public confidence. We have also published an insightful review on Reproducible Analytical Pipelines and our research programme.

The use of statistics during the pandemic

Statistics have and will continue to play an important and extremely visible role in all our lives. I recently provided evidence to the inquiry run by the House of Commons Public Administration and Constitutional Affairs Committee on the use of data during the pandemic. Since the start of the pandemic, Governments across the UK have maintained a flow of data which has been quite remarkable. We continue to push for further progress, for example on vaccination data.

Statistical Leadership

One thing that the pandemic has highlighted is how important it is for leaders to be analytical, and this is something that our Statistical Leadership report published recently highlights.

Good analytical leadership will be crucial to answering the many questions that have arisen over the course of the pandemic and continue to come to light including the importance of transparency. We are currently planning an in-depth discussion on these issues and more for our second OSR annual conference, which we aim to host later this year, focusing on high quality data, statistics and evidence.

Looking Forward

There are lots of good things happening for statistics at present. I was delighted to see changes to pre-release access in Scotland because equality of access to official statistics is a fundamental principle of statistical good practice.

I am also really looking forward to announcing the results of our 2021 annual award for Statistical Excellence in Trustworthiness, Quality and Value in July. This is the second year we have worked in partnership with the Royal Statistical Society to offer the award.

Keep up to date with our latest work and news by following us on Twitter, and sign up to our monthly newsletter.

Which COVID-19 deaths figures should I be looking at?

Every day we see figures for number of COVID-19 deaths in the UK quoted in the media, but what do these mean, and which figures should we pay most attention to?

With the rising death rate, and the complexity and potential confusion surrounding this seemingly straightforward measure of the impact of COVID-19, we are increasingly being asked our view on which data should be regarded as the best measure of COVID-19 deaths.

Of course, whichever way the numbers are presented, each individual death is a sad event. But it is really important to understand the strengths and limitations of the data being considered in order to understand the pandemic and learn from what the UK has experienced.

There are many official sources of data and each has a place in helping understand the impact of COVID-19. Our blog from August goes in to more detail about the difference sources, their uses and limitations. Here we outline some of the key issues to consider when thinking about which figures to use.

What is the difference between figures by date of death and figures based on date reported? Which should I use?

A commonly used headline is the number of deaths reported each day in the UK Government’s coronavirus dashboard, based on deaths which occurred within 28 days of a positive COVID-19 test. This has the advantage of capturing all newly reported deaths each day. It is understandable that this figure makes headlines as it is the timeliest data published, and captures all the additional deaths (within 28 days of a positive COVID-19 test) which government has been made aware of within the previous 24 hour reporting period. However, it has limitations and it is really important that in the reporting of these figures the implications of these limitations are clear.

As well as data by date reported the UK government coronavirus dashboard includes data on deaths within 28 days of a positive COVID-19 test by date of death on the deaths page of the dashboard. These are usually considered to be reasonably complete from about five days after the reference date. Looking at data by date reported shows large fluctuations in numbers, particularly after weekends and bank holidays. Data on date of death will give a better sense of the development of the pandemic and the changing rate of deaths.

This difference between figures for date reported and date of death has been particularly notable in the period following Christmas and New Year given bank holidays and the higher rates of deaths seen over the period. For example, looking at data published on 21 January for deaths within 28 days of a positive COVID-19 test:

  • Deaths by date of death have a current peak on 12 January with 1,117 deaths (compared with a peak of 1,073 on the 8 April).
  • Deaths by date reported have a peak of 1,820 deaths on 20 January (compared with 1,224 on 21 April).

Data by date of death should always be used if possible.

How can I best understand if COVID-19 was the cause of death?

The data outlined on the coronavirus dashboard, highlighted above, are based on deaths within 28 days of a positive test. There will be occasions within these cases where an individual had a positive COVID-19 test, but this was unrelated to the subsequent death. There will also be cases where a death was due to COVID-19 but occurred more than 28 days after a positive test result. PHE has published information in a technical note which looks at the impact of the 28 day cut off compared with alternative measures.

A more reliable measure is based on data drawn directly from the system of death registrations and includes data where COVID-19 is mentioned on the death certificate. The Office for National Statistics (ONS) publishes weekly figures, including a UK figure drawing on data from National Records Scotland (NRS) and Northern Ireland Statistics and Research Agency (NISRA).

ONS data are based on information from death certificates and include cases where COVID-19 is likely to have contributed to death (either confirmed or suspected) in the opinion of the certifying doctor. The provisional count is published weekly, 11 days after the end of the time period it covers. These data have many strengths, but provisional figures first published will not capture all deaths due to registration delays.

How can I best understand the impact of the pandemic on deaths?

The measures outlined above all aim to give counts of deaths where COVID-19 infection was a factor in the death. A broader measure which looks at the change in deaths because of the pandemic, whether or not due to a COVID-19 infection, is “excess deaths”. This is the difference between the number of deaths we would expect to have observed and the number of deaths we have seen. This is generally considered to be the best way to estimate the impact of a pandemic or other major event on the death rate.

ONS published a blog alongside its latest publication of excess deaths, which highlights the complexities in this measure. For example, a single figure of how many deaths there have been one year compared with a previous year may not be helpful, due to changes in the population. For this reason, in addition to providing the counts of total deaths, ONS produces estimates for excess deaths in a number of different ways. In its weekly statistics it compares numbers and rates to a five-year average, so that is comparing a similar period in terms of life expectancy, advances in healthcare, population size and shape. It also publishes Age Standardised Mortality Rates for England and Wales so that rates taking into account changes to the population size and structure can be compared.

The people behind the Office for Statistics Regulation in 2020

This year I’ve written 9 blogs, ranging from an exploration of data gaps to a celebration of the armchair epidemiologists. I was thinking of making it to double figures, setting out my reflections across a tumultuous year. And describing my pride in what the Office for Statistics Regulation team has delivered. But, as so often in OSR, the team is way ahead of me. They’ve pulled together their own year-end reflections into a short summary. Their pride in their work, and their commitment to the public good of statistics, really say far more than anything I could write; it’s just a much better summary.

So here it is (merry Christmas)

Ed Humpherson

Donna Livesey – Business Manager

2020 has been a hard year for everyone, with many very personally affected by the pandemic. Moving from a bustling office environment to living and working home alone had the potential to make for a pretty lonely existence, but I’ve been very lucky.

This year has only confirmed what a special group of people I work with in OSR. Everyone has been working very hard but we have taken time to support each other, to continue to work collaboratively to find creative solutions to new challenges, and to generously share our lives, be it our families or our menagerie of pets, all be it virtually.

I am so proud to work with a team that have such a passion for ensuring the public get the statistics and data they need to make sense of the world around them, while showing empathy for the pressures producers of statistics are under at this time.

We all know that the public will continue to look to us beyond the pandemic, as the independent regulator, to ensure statistics honestly and transparently answer the important questions about the longer term impacts on all aspects of our lives, and our childrens’ lives. I know we are all ready for that challenge, as we are all ready for that day when we can all get together in person.


Caroline Jones – Statistics Regulator, Health and Social Care Lead

2020 started off under lockdown, with the nation gripped by the COVID-19 pandemic and avidly perusing the daily number of deaths, number of tests, volume of hospitalisations and number of vaccines. This level of anxiety has pushed more people into contacting OSR to ask for better statistics, and it has been a privilege to work at the vanguard of the improvement to the statistics.

To manage the workload, the Health domain met daily with Mary (Deputy Director for Regulation) and Katy, who manages our casework, so we could coordinate the volume of health related casework we were getting in. We felt it important to deal sympathetically with statistic producers, who have been under immense pressure this year, to ensure they changed their outputs to ensure they were producing the best statistics possible. It’s been rewarding to be part of that improvement and change, but we still have a lot of work to do in 2021 to continue to advocate for better social and community care statistics.


Leah Skinner – Digital Communications Officer

As a communications professional who loves words, I very often stop and wonder how I ended up working in an environment with so many numbers. But if 2020 has taught me anything, it’s that the communication of those numbers, in a way that the public can understand, is crucial to make sure that the public have trust in statistics.

This has made me reflect on my own work, and I am more determined than ever to make our work, complex as it can be, as accessible and as understandable to our audiences as possible. For me, the highlight of this year has been watching our audience grow as we have improved our Twitter outputs and launched our own website. I really enjoy seeing people who have never reached out to us before contacting us to work with us, whether it be to do with Voluntary Application of the Code, or to highlight casework.

As truly awful as 2020 has been, it is clear now that the public are far more aware of how statistics affect our everyday lives, and this empowers us to ask more questions about the quality and trustworthiness of data and hold organisations to account when the data isn’t good enough.


Mark Pont – Assessment Programme Lead

For me, through the challenges of 2020, it’s been great to see the OSR team show itself as a supportive regulator. Of course we’ve made some strong interventions where these have been needed to champion the public good of statistics and data. But much of our influence comes through the support and challenge we offer to statistics producers.

We published some of our findings in the form of rapid regulatory review letters. However, much of our support and challenge was behind the scenes, which is just as valuable.

During the early days of the pandemic we had uncountable chats with teams across the statistical system as they wrestled with how to generate the important insights that many of us needed. All this in the absence of the usual long-standing data sources and while protecting often restricted and vulnerable workforces who were adapting to new ways of working. It was fantastic to walk through those exciting developments with statistical producers, seeing first-hand the rapid exploitation of new data sources.

2021 will still be challenging for many of us. Hopefully many aspects of life will start to return to something closer to what we were used to. But I think the statistical system, including us as regulators, will start 2021 from a much higher base than 2020 and I look forward to seeing many more exciting developments in the world of official statistics.


Emily Carless – Statistics Regulator, Children, Education and Skills Lead

2020 has been a challenging year for producers and users of children, education and skills statistics which has had a life changing impact on the people who the statistics are about.  We started the year polishing the report of our review of post-16 education and skills statistics and are finishing it polishing the report of our review of the approach to developing the statistical models designed for awarding grades.  These statistical models had a profound impact on young people’s lives and on public confidence in statistics and statistical models.

As in other domains, statistics have needed to be developed quickly to meet the need for data on the impact of the pandemic on children and the education system, and to inform decisions such as those around re-opening schools. The demand for statistics in this area continues to grow to ensure that the impact of the pandemic on this generation can be fully understood.

Now, about that Excel spreadsheet…

I wouldn’t blame you if you were scratching your head at the outrage expressed last week that Excel was being used to record the information on COVID-19 test results in England. After all, it’s the most used spreadsheet tool in the world. It’s also a computer programme which, along with other proprietary software, has been used in public sector analysis for decades.

The reason for all this concern is that it’s easy to make mistakes with Excel – like referencing the wrong cell in a calculation (we’ve all done it). And once you’ve made the mistake, it’s hard to find it. It’s not clear who has been using your spreadsheet and changed it (or, even worse, whether Excel has taken it upon itself to change it for you). This might not matter if your spreadsheet is for holiday planning or your personal budget (yes, we’re those kind of nerds). It definitely does matter when your spreadsheet is used by multiple people to produce and present official statistics, and what’s more – there is a better way.

Many statisticians and analysts are now starting to think differently and move away from off-the-shelf software with the aim of solving these problems. Within the Government Statistical Service this approach is known as a Reproducible Analytical Pipeline (also fondly referred to as RAP). It’s sometimes mis-characterised as simply automation, but it is so much more than that.

So…What is RAP?

RAP is a set of good practices and principles. RAP requires built-in checks and ensures a guaranteed audit trail of changes using version control software like git (which comes in handy if something goes wrong and you need to roll back a version!). It champions working in the open, through the publication and peer review of code on sharing and version control platforms such as GitHub. This allows collaboration, reuse of code by others and improves trust from users. RAP also enshrines good practice, such as well-commented and documented code, or appropriately stored and structured data. These good practices help prevent all sorts of issues from creeping in – like the flow of data being disrupted as a result of processes that are easily manually manipulated.

The end result is a higher quality, more transparent and more efficient process, allowing more time for statisticians to use their skills to add insight and value to their outputs.

RAP to the Future

At the Office for Statistics Regulation (OSR), we see the incredible progress that has been made by official statistics producers to RAP their work. But this progress appears in pockets and there is still a way to go to make sure that RAP is not only the default approach, but that all of its elements are applied. We know that barriers to RAP exist, whether it’s access to the right tools and training or the time and support to carry out the upfront work required. This is why at OSR we have launched a review to explore the use of RAP across government statistics in more detail. We want to better understand what enables successful implementation of RAP and what prevents people either implementing RAP fully or applying elements of it. If we understand these barriers then we can do more to help resolve them and ultimately the quality, trustworthiness and value of official statistics will improve.

Now, about that Excel spreadsheet…

COVID-19 has challenged statistics producers in a way that has never been seen before and they should be proud of the way they have risen to this challenge. Statistics were (and are being) produced from scratch and at record pace to inform both government and the public during these unprecedented times and this contribution should be celebrated. While the error with the Excel spreadsheet was not directly part of official statistics production there are still lessons we can learn from it and it highlights some important questions such as:

  • what tools and support were available to producers when they needed it most?
  • was RAP the approach taken to setting up this new work? If not, why not?
  • and how can the good practices of RAP be effectively implemented when time is short and the pressure is high?

Although our review does not focus only on COVID-19 statistics, these are the sort of questions we want to explore in order to help statistics producers on their RAP journey. If you have experience with this, or any other RAP process, please contact us at Anna.Price@Statistics.gov.uk or Emily.Tew@statistics.gov.uk – we’d love to hear your views.

Because while we can’t fix the past, we should RAP the future.

Closing data gaps: understanding the impact of Covid-19 on income

In recent weeks, you may have spoken with friends and family who’ve seen their income and living standards impacted in some way by COVID-19. They may have been furloughed and are concerned about whether they will have a job to return to or perhaps they have experienced a reduction in business if they are self-employed. Maybe your own household is receiving less income and you are struggling to juggle household costs with home schooling.

Despite the UK starting to ease the lockdown measures it introduced in response to COVID-19, the impact of this pandemic on the labour market and people’s livelihoods is expected to continue for some time. We are already seeing signs of the scale of the impact on the labour market; from vacancies at a record low in May to new claims to Universal Credit passing 2.5 million between March and June. The Office for National Statistics (ONS) recently brought forward the launch of its online Labour Market Survey to help provide the necessary insight into the impact of COVID-19 on people’s employment and working patterns.

There is a range of data which can help us understand how jobs and employment have been affected but we need better data on income and earnings to fully understand the narrative of how people’s livelihoods and living standards are being affected by the pandemic. A recent Opinions and Lifestyle Survey by the ONS found that half of the self-employed reported a loss of household income, compared with 22% of employees, in the month of April. Last year, we wrote to the ONS, Department for Work and Pensions and HMRC to restate the importance of delivering the insights identified in our work on the Coherence and Accessibility of Official Statistics on Income and Earnings. Whilst some progress has been made since our findings were published in 2014, it has been slow to date and more work needs to be done to help users understand the dynamics of the labour market and to address key data gaps in relation to income and earnings.

We have recently carried out work to look at examples of data gaps being addressed in the statistical system. Our work found three common themes in successful cases of solving data gaps: sufficient resource (whether new or restructured), high user demand and strong statistical leadership. The combination of new user demand for information on income and earnings that has emerged from COVID-19, restructured resource that has been put in place to respond to this demand, and the potential for statistical leadership to shine, could be the catalyst for solving these data gaps.

Improving the storytelling of income and earnings and addressing the data gaps identified by OSR could help users better understand the lived experience of households and different employment types throughout the pandemic. These are difficult times for many people from all walks of life and people are facing lots of unknowns. It is important that we can understand the true scale of the impact so that when the UK begins its recovery from the pandemic, support can be targeted effectively towards the groups most severely affected. There are two areas in particular in which solving data gaps could improve our understanding of COVID-19.

 Household level data is not keeping pace with individuals

Household measures of income and earnings have traditionally been less timely than measures for individuals and this formed a key area of our findings in the work highlighted above. With respect to COVID-19, there is interest in understanding how the Government’s income support measures have impacted income for different household types such as those with children or lone parent households. Even in households which are not receiving any income support, people may have had to adapt their working patterns to share the responsibility of childcare which may lead to one or both of the earners in a household working reduced hours on potentially reduced pay. HMRC has published data which shows that 9.1 million jobs had been furloughed by mid-June but we won’t see any contextual data about the impact on households until 2022 in the Family Resources Survey. We hope the relevant statistical teams explore new ways to deliver this insight in the meantime.

 There are lots we don’t know about the world of the self-employed and business owners

It is notoriously difficult to capture information on the income and earnings of the self-employed or those who own businesses. This is because many earn less that the taxable allowance so are not captured in statistics relating to income tax and many don’t have predictable earnings so we don’t know what they’ll earn until well after the year end. The surveys which do manage to collect information on the self-employed are less timely than those for employees. When the Chancellor announced the Self-Employment Income Support Scheme, it quickly emerged that more people would need the support than originally anticipated and that the eligibility criteria would need to be adjusted to reflect the various ways that the self-employed can pay themselves. Improving the timeliness and completeness of information on the income of the self-employed could help identify groups of individuals who currently fall through the gaps of eligibility for the income support schemes in place.

Investigating social connectivity and loneliness in our changing world

Over the last few months while we’ve been social distancing, some of us have been self-isolating, and many of us have been and will continue to experience social connectivity in a different way.

Prior to the Covid-19 crisis, we started looking at statistics around loneliness and social isolation. Over the past six months we’ve been speaking with producers and users of statistics on loneliness and social connectivity to inform a systemic review. We met with statisticians and policy colleagues working on loneliness and we’ve spoken to charities, non-governmental organisations and academics interested in this area. We’ve had some really interesting conversations on the public need for these types of data, and we’ve taken on board a wide range of views.

We’ve been planning a review of loneliness and social connectivity statistics for some time, but we could not have predicted how the COVID-19 pandemic has influenced all our daily lives, and how enforced social distancing would lead us all to consider loneliness and social connectivity in terms of our own experiences.

Now more than ever, it is important that statistics and data on social connectivity and loneliness reflect the world we live in, and that this data is accessible to those who need it to provide services and support. We all need to be able to understand who is most likely to be affected by loneliness, and how social connectivity influences our lives.

It’s important that statistics provide an aggregated picture – amassing all the personal stories into a wider perspective. At their best, statistics illuminate our lives and help us understand the lives of others. But sometimes they can fail at this – they can appear impersonal, reducing the mass of experience into single arid numbers. Behind all the numbers lie human stories.

So, to mark Loneliness Awareness week, we decided that instead of talking about the big national numbers, we’d share about our own personal experiences of loneliness, connection and hope in lockdown.

Louisa – Statistics Regulator currently on Maternity Leave:

I knew that starting maternity leave and becoming a Mum had the potential to be a lonely time, but of course, I could never have guessed this is how it would turn out. We were lucky; our son was born six weeks before lockdown, and so to begin with, many of our friends and family were able to visit. However, once lockdown started, and the visits stopped, I did start to feel lonely. As lockdown has eased, I have really appreciated increased social contact, but it seems unlikely many of the activities I had planned are likely to start up again soon. For now, even at a distance,  my son enjoys having people to watch, and I am thankful that at his age the lack of wider social contact is unlikely to affect him. I think, however, understanding the impact of loneliness on new Mums, as well as the impact of limited social connectivity for older babies and toddlers, will be important.

Mark – Head of Newport Office

I’m from a generation where working from home just wasn’t a ‘thing’ so have always preferred working in the office. I find it gives order and structure to my day – and during the first few days of lockdown, it was that structure that I really missed, and had to find a way to replicate at home. I’ve found it’s important to be proactive in establishing a way to maintain an order to my day. I’m an intermittently avid cyclist so disciplining myself to get out on the bike first thing in the morning gives me that routine and gets my head clear ready for the day ahead. I’ve never been so grateful for the great spring weather we enjoyed. I’ve made a conscious effort to try to keep social interaction up during lockdown – phoning colleagues for a chat to see how they’re doing. I think it’s really important to keep talking.

Zayn – Statistics Regulator

Reflecting on the last 13 weeks – it feels like so much has happened, and at the same time, it feels like nothing has happened at all. May was the month I was most looking forward to in 2020 – it was my 21st birthday and I was invited to the film festival in Cannes. Neither of these really went how I would’ve liked them to, but I look forward to visiting Cannes in the future and turning 21 again next year (that’s how it works, right?). I guess my one wish would be to go back to the office before my placement ends, it wouldn’t feel right leaving without the chance to say a proper goodbye.


Liddy – Statistics Regulator

I’ve adapted to working from home and connecting with friends virtually, and I know this experience is very familiar to some, but very different to many others. For example, three years ago my granddad passed away which left my grandma on her own. She has a really strong support network that she would normally meet almost daily. During the pandemic she has struggled with loneliness. It has been really tough, but she’s adapted by learning how to use Zoom, distracting herself with gardening, and now she’s able to, going on socially distanced walks with her friends again.

Gemma – Statistics Regulator

Before lockdown I used to rely a lot on family for childcare as I was office-based five days a week, so losing that support quite literally overnight was hard to get used to. But they’ve still helped hugely by always being at the other end of the phone. My sons have been able to stay in contact with their friends through chatting on their games consoles, and they’ve also had some lovely phone calls from their school teachers checking that they’re ok. For me, accepting that they aren’t baking, doing arts and crafts or PE with Joe Wicks (sorry Joe!), as well as a good playlist and a cupboard full of snacks has been what’s kept us all sane!

Gail – Head of Edinburgh Office:

“Mum, I am cripplingly lonely” – a hard thing for any fourteen year old boy to admit to his mum. Social connectiveness, something my teen boys took for granted, has all but disappeared. Children across the UK, kids just like my boys, are living through an extended period of unplanned and unexpected severe isolation. Most of them will bounce back from this, as I hope mine will. Not all children will though, and it is likely that many will need support to address emotional and practical needs both in the short and longer term. We need to support this generation of children and good data can do that. Data that is up to date and accurately reflects the prevalence and type of need, not only at the level where support is needed, but which is consistent and can be joined with other data to give the bigger picture.


We’re also carrying out a related but separate systemic review on Mental Health statistics in England, the results of which will be published shortly.

If you’re feeling lonely and would like some advice or support, you can visit the Campaign to End Loneliness, who have recently published a blog with some guidance on how to deal with loneliness at the moment. If you’re feeling anxious or worried about Coronavirus, the charity Mind offer guidance and support on their website. Stay up to date with the latest health guidance on the NHS website.

Out of the shadows: The value of data in times of crisis

Data has played an important role in responding to the Covid-19 pandemic, driving newfound recognition of its value in understanding society and shaping policy.

One of the features of the pandemic is that it has taught us the value of things that may have been taken for granted: family, social contact, key workers who keep society going.

To that list I’d add data. I wrote last month that public access to trustworthy data has been one of the stories of this pandemic. As every week goes by, data seem more and more central to public discourse. Just look at the R number: until recently an obscure technical term to describe patterns of infection reproduction, it has become common currency, with immense attention invested in small movements above or below 1. At the OSR, we published a short statement on the publication of the R number on 9 June. Data has come out of the shadows.

Why is this? Why has the trustworthiness, quality and value of data played such a prominent role in discussions of the pandemic?

There are three main factors.

First, this is a pandemic that has affected everyone in the country. We have all changed our behaviours and lives in a way that was unimaginable even a few months ago. This degree of public behaviour change has been possible at least in part because regular publication of data on cases, excess deaths, care homes, and pressures on health services have shown us the scale of the pandemic. When we hear that adopting social distancing really matters, we can see it immediately in the data. This has been a society-wide event, best understood through the lens of aggregated data on society.

Second, the governments of the UK have been making big decisions on the basis of data and other forms of scientific evidence. Transparency is a basic requirement of democratic legitimacy: to share the data on which key decisions are made. The UK’s four governments have sought to be transparent with their data during the pandemic. Indeed, my team have repeatedly advocated the publication of the UK Government’s administrative data on issues like transport usepublic healthsocial security claims and homelessness. And government analysts across the UK have risen to the challenge to make existing and new data available to the public. It’s been an immense effort by analysts in the Welsh Government, Scottish Government, Northern Ireland administration, and in the Whitehall departments to rise to this challenge.

Third, we are learning more about the pandemic all the time – its patterns of transmission, the vulnerabilities of different parts of society. The focus on the differential mortality impacts for different ethnicities is only possible because of a careful and rigorous analysis of the underlying datasets by analysts in agencies like the Office for National Statistics (ONS)Public Health England and researchers at the Institute for Fiscal Studies. Their efforts have been replicated by analysts in Wales, Scotland and Northern Ireland. Data help us understand more about the pandemic, in something approaching real time.

Our work focuses on the foundations of public confidence in statistics and data. We have seen that these foundations – trustworthiness, quality, value – apply with particular force during a pandemic. People want to be sure that data they are hearing and seeing are reliable and relevant.

The administrative data research community has long known of, and talked about, the benefits to society of use of administrative data. At times, it has felt like an uphill struggle to convince stakeholders that this should be a priority. The pandemic demonstrates the value very well indeed.

We will never have a better opportunity to make the case that data are hugely valuable to society. We should make sure we take it.


This blog was written for ADR UK and has also been published on their website.