An army of armchair epidemiologists

Statistics Regulator, Emily Carless explores the work done to communicate data on Covid-19 publicly, from inside and outside the official statistics system, supporting an army of armchair epidemiologists. 

In 2020, our director Ed Humpherson blogged about the growing phenomenon of the armchair epidemiologist. Well, during the pandemic I became an armchair epidemiologist too. Or maybe a sofa statistical story seeker as I don’t have an armchair! Even though I lead our Children, Education and Skills domain rather than working on health statistics, I couldn’t help but pay close attention to the statistics and what they could tell me about the pandemic

At the micro-level I was looking at the dashboards on a near daily basis to understand the risks to myself, my family, my friends and my colleagues. I was watching the numbers of cases and hospitalisations avidly and looking at the rates in the local areas of importance to me. I felt anxious when the area where my step-sister lives was one of the first to go the new darkest colour shortly before Christmas 2021, particularly as my dad and step-mum would be visiting there soon afterwards. Earlier in the pandemic, once we were allowed to meet up, my mum and I had used these numbers to inform when we felt comfortable going for a walk together and when we felt it was better to stay away for a while to reduce the risk of transmission. These statistics were informing real world decisions for us.

At a macro-level I was also very interested in the stories the statistics were telling about the pandemic at a population level. The graphs on the dashboards were doing a great job of telling high level stories but I was also drawn to the wealth of additional analysis that was being produced by third parties on twitter. My feed was full of amazing visualisations that were providing additional insight beyond that which the statistical teams in official statistics producer organisations had the resources to produce.

As we highlighted in our recent State of the Statistical System report, the COVID-19 dashboard has remained a source of good practice. The dashboard won our Statistical Excellence in Trustworthiness, Quality and Value Award 2022. The ability for others to easily download the data from the COVID-19 dashboard to produce visualisations and bring further insight has been a key strength. I wanted to write this blog to further highlight the benefits of making data available for this type of re-use. I think Clare Griffith’s (lead for UK COVID-19 dashboard) tweet back in February sums it up perfectly. In response to one of the third-party twitter threads she said ‘Stonking use of dashboard data to add value. Shows what can be done by not trying to do everything ourselves but making open data available to everyone.’ 

Here are a couple of my favourite visualisations (reproduced with permission). 

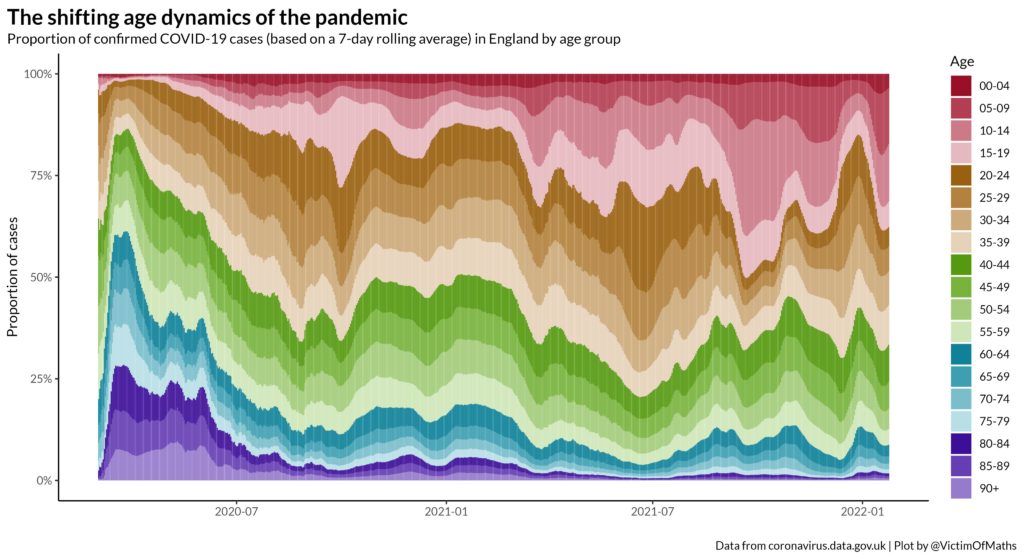
Like Clare, I really like Colin Angus’ (@VictimOfMaths) tapestry by age. It shows the proportion of confirmed Covid-19 cases in England by age group and how that changed during the pandemic. I also liked the way the twitter thread explained the stories within the data and that they made the code available for others. 
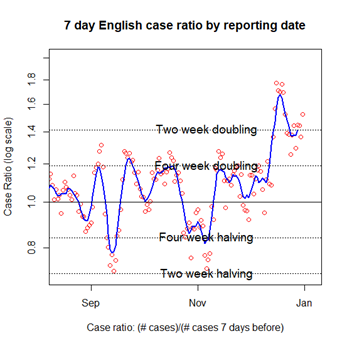
I also liked Oliver Johnson’s (@BristOliver) case ratio (logscale) plots. Although the concept behind them may have been complex, they told you what was happening with cases/ hospitalisations. The plot shows the 7-day English case ratio by reporting date on a log scale using horizontal lines to show where the case ratio showed a two or four week doubling or halving.
There was great work being done to communicate data on Covid-19 publicly from outside the official statistics system, supporting an army of armchair epidemiologists. This demonstrates the changing statistical landscape of increased commentary around official statistics, which we referenced in the latest State of the Statistical System report, at its best. Much of this was made possible by the Covid-19 dashboard team making the data available to download in an open format through an API with good explanations and engaging on social media to form a community around those data. We hope that this approach can be replicated in other topic areas to maximise the use of data for the public good.

Driving the change to make health statistics more coherent

Emma Sharland of the English Health Statistics and Steering Group reviews the work they have undertaken to make health statistics in England more coherent, following a Systemic Review undertaken by OSR

In 2015, the Office for Statistics Regulation (OSR) identified that producers of health and care statistics in England were struggling to provide coherent, comparable and easily accessible information. This was because these statistics were produced by several different organisations. They had no single point of access, comprised different methodologies and definitions, and were hard to access.

To resolve this issue, in 2016, members from key statistical producers formed the English Health Statistics and Steering Group (EHSSG). The aim of this group is to improve coherence and accessibility of health and care statistics in England by:

  • removing duplication of statistical releases
  • harmonising methodology and definitions
  • increasing user engagement
  • aligning publication dates
  • improving accessibility of statistics

The Covid-19 pandemic has continued to highlight the importance of easily accessible, comparable, and high-quality health and care statistics. The pandemic itself caused progress in some of these aims to be stalled, but we are refocused on delivering against our aims.

The English Health Statistics Steering Group (EHSSG) is now led by Julie Stanborough in the Office for National Statistics (ONS). We have recently produced a new workplan reflecting on the changing landscape of health and care statistics following the pandemic. This workplan enables us to drive forward changes to enhance the coherence, production, dissemination and accessibility of health and care statistics in England. The group meets quarterly and has membership from all the key health and care statistics producers. We also engage with the new Health Statistics Leadership Forum, led by Lucy Vickers in the Department of Health and Social Care (DHSC).

Attached to the EHSSG are 15 theme groups focusing on specific topics in health and care. Each theme group is chaired by a lead from one statistics provider and have membership from all official statistics producers. They are in the process of putting together their action plans to ensure their aims reflect the objectives of the EHSSG.

Our Smoking Theme Group have aligned their publication dates to improve the coherence of the communications on this topic whilst the Disability Theme Group have reviewed how disability is measured and are encouraging data collectors to use harmonised methods. The Adult Social Care Theme Group have been able to fill some gaps on the statistics about adult social care and carers, for example, the characteristics of unpaid carers.

Alongside the theme groups we have an interactive tool which compiles all official statistics publications and datasets relevant to health and care in England in one place. You will also find COVID-19 publications from across the UK. You can use this tool to find publications by theme, by producer and by geography. We update this tool monthly, and we currently have over 850 publications and datasets incorporated.

We also produce a monthly health and care newsletter which highlights key publications and information relating to health and care statistics. We are in the process of redesigning this newsletter to focus more on the work of the EHSSG and its associated theme groups to ensure we provide regular updates on a variety of health and care related topics. You can sign up to the newsletter here.

We want to do more…

Health and care statistics are forever evolving just as the health sector and needs of patients and communities are always changing and as such, we would like to reach out to users of health and care statistics to understand more about your needs and how we can help.

To raise anything to us at the EHSSG, including feedback on our newsletter, please contact us via our mailbox gss.health@ons.gov.uk

For further information

For more information, please visit our GSS Health and Care Statistics webpages, contact us on GSS.health@ons.gov.uk and follow us on twitter @GSS_health

Guest Blog: National Statistics – The Road to Accreditation

The Office for Statistics Regulation has today designated the Family Practitioner Services statistics in Northern Ireland as National Statistics.

In this guest blog, Martin Mayock, Head of the Family Practitioner Services (FPS) Information Unit in Northern Ireland’s Health and Social Care (HSC) Business Services Organisation (BSO), and a Senior Statistician in the Northern Ireland Statistics and Research Agency (NISRA), discusses his experience of the assessment process – which wasn’t, in fact, as daunting as his team first thought!

By way of background, Information Unit had always produced a wealth of information across primary care: medical, ophthalmic, dental and pharmaceutical services for internal use by our health policy and operational colleagues. We even, on occasion, publicly released various ad-hoc reports and tables but were a long way short of being a Code-compliant organisation. This despite BSO being a legally specified producer of Official Statistics (OS) since 2012. It’s not that we didn’t recognise the importance of compliance, it was simply a matter of resources and carving out sufficient time from our day-to-day analytical project support, to progress our OS aspirations. The key was good planning and accepting that this would not be done overnight, taking whatever time was necessary to update our processes, plug identified gaps and develop documentation. Of course, we needed the backing of senior management if we were going to be “distracted” from the day job so we first had to sell the benefits. 

Our first milestone was to release an Annual Compendium in 2018, covering all of our key primary care areas, complying with the Code as far as possible. A quarterly series soon followed and by our third year, responding to user demand, we were ready to split the compendium into separate service areas with a dedicated team responsible for each. User engagement was a key component of the work programme with readership surveys, supplemented by targeted stakeholder interviews, allowing each release to evolve in a way most beneficial to its user base. The fact that our teams were both users, through our ongoing project work, and producers of the data helped enormously in improving its quality and offering guidance on its use. 

By our fourth year, and following two successive releases of our service specific publications, we were finally ready to push the button and subject our outputs to the all seeing eye of the OSR. Yes, it had taken a few years to get to this point, albeit from a fairly low base, but we now felt confident that our processes were in order and we had a good story to tell. The invite was duly issued in November ‘21 and we had our assessment initiation meeting with the OSR team, headed by Dr Anna Price, in January this year. Everything was clearly explained to us in terms of how the process would run and what would be expected from us by way of evidence. The OSR team, comprising Anna, Jo Mulligan and Sarah Whitehead, were really open and friendly (surely a ruse to get us to lower our guard lol) and keen to help with various initiatives that we were planning such as the introduction of Reproducible Analytical Pipelines into our production process. It all seemed reasonably straightforward and, certainly as a veteran of 4 previous assessment campaigns in other NI Departments, much less formal and bureaucratic than I had remembered – can’t last, I thought! 

Roll forward to February, and we had our follow up meeting with the assessment team to discuss our submitted evidence but also, importantly, draw upon information the team had gleaned from our users. This meeting involved all of our publication leads so, with virtual flak jackets donned, we braced ourselves for the inevitable onslaught. But, again, we were pleasantly surprised. The meeting was more like an interesting chat around our various processes, with helpful suggestions and resources offered which could further enhance our outputs. Of course, there were queries and clarifications sought, some of which were followed up in writing in the weeks that followed, but these were conveyed in a constructive way and the different perspective offered us an opportunity to highlight aspects of our process that we’d overlooked in our initial evidence submission.

We received first sight of our draft assessment report the following month and I admit to opening the document with a feeling of slight trepidation. I’d had the impression that the team felt we were in reasonable shape from our meetings but there’s always requirements, I mean they have to find something, right? But no, I read the report twice, definitely no requirements! What it did contain was a succinct summary of how we matched up against the Code of Practice pillars of Trustworthiness, Quality and Value along with some helpful suggestions of where we could enhance our outputs against these. Several useful resources which we might find useful in this regard were also signposted. We had an opportunity to suggest any amendments and correct any factual inaccuracies, of which there were very few, and several weeks later we were notified that the report and recommendation to designate our outputs as National Statistics had been accepted by OSR Regulation Committee. Our journey was finally complete! Of course, it never really ends and we will need to continue to improve and innovate to ensure standards are maintained and the needs of ever more demanding users continue to be satisfied.

Before signing off, I thought I’d leave you with what I feel were the three most important factors in helping us achieve our designation so painlessly.

  • Invest time achieving proper buy-in from senior management within your organisation – you will need their support to allow you to spend time developing aspects of your processes that they may not immediately see as being important to their core business.
  • Prepare, Prepare, Prepare – Don’t rush to get your outputs assessed, wait until you are properly ready. We were also able to draw upon the support of our colleagues in the Northern Ireland Statistics and Research Agency (NISRA) who provided lots of good advice and resources, including other relevant assessment reports. The assessment focus can change over time and statisticians are constantly innovating. We can learn a lot from our peers. I’m not saying take 4 years but, if you invite an assessment too early, then you will leave yourself with a limited window, typically 3 months, in which to meet requirements. This could feel like a burden on top of your business as usual. Better to meet as many potential requirements ahead of time as possible.
  • Have similar outputs assessed as a batch – it might seem tempting to submit individual outputs for assessment in order to make the process more manageable or you may feel that some are more ready than others. However, there can be synergies between outputs and processes that make sense to consider together. We also included all of our publication leads when we met with the assessment team and this all helped deliver a more rounded and efficient assessment.

In my experience, the assessment process itself has definitely evolved for the better and feels more like a collaborative venture these days rather than a statistical audit. It definitely feels more light touch than previously and, although a lot of hard yards are still required to ready your outputs, it is great to see that your efforts will be recognised by the assessment team. 

The Family Practitioner Services statistics in Northern Ireland assessment report has been published today, less than six months since the initial invite for assessment. 

All-in-all we found it to be a very worthwhile and positive experience so if you are thinking of taking the plunge then go for it, you might just be pleasantly surprised! 

QCovid® case study: Lessons in commanding public confidence in models

Methods expert, Jo Mulligan gives an insight into the lessons learned from using the QCovid® risk calculator in commanding public confidence in models

I re-joined OSR around 15 months ago in a newly created regulator role as a methods ‘expert’ (I struggle with the use of the word ‘expert’ as how could anyone be an expert in all statistical methods? – answers on a postcard please). Anyway, with my methods hat on, myself and several colleagues have been testing the lessons that came out of our review of the statistical models designed to award grades in 2020. That review looked at the approach taken to developing statistical models to award grades in the absence of exams that were cancelled because of the pandemic. Through this work, OSR established key factors that impacted on public confidence and identified these lessons to be useful for those developing models and algorithms in the future.

Applying our lessons learnt to QCovid®

We wanted to see if the lessons learnt from our review of the grading models in 2020 could be applied in a different context, to a different sort of algorithm, and test whether the framework stood up to scrutiny. We chose another model to carry out the testing, the QCovid® risk calculator, also developed in response to the pandemic.

In 2020, the Chief Medical Officer of England commissioned the development of a predictive risk model for COVID-19. A collaborative approach was taken, involving members from the Department of Health and Social Care (DHSC), NHS Digital, NHS England, the Office for National Statistics, Public Health England, University of Oxford plus researchers from other UK Universities, NERVTAG, Oxford University Innovations, and the Winton Centre for Risk and Evidence Communication. It was a UK wide approach agreed and including academics from Wales, Scotland and Northern Ireland. 

The original QCovid® model that we reviewed calculates an individual’s combined risk of catching COVID-19 and dying from it, allowing for the inclusion of various risk factors. The QCovid® risk prediction model calculates both the absolute risk and the relative risk of catching and dying from COVID-19. The QCovid® model also calculates the risk of catching COVID-19 and being hospitalised but these results were not used in the Population Risk Assessment.

What is an absolute risk?: This is the risk to an individual based on what happened to other people with the same risk factors who caught COVID-19 and died as a result.

What is a relative risk?: This is the risk of COVID-19 to an individual compared to someone of the same age and sex but without the other risk factors.

The academic team, led by the University of Oxford, developed the model using the health records of over eight million people. It identified certain factors, such as age, sex, BMI, ethnicity and existing medical conditions, that affected the risk of being hospitalised or dying from COVID-19. The team then tested the model to check its performance using the anonymised patient data of over two million other people. Having identified these risk factors, NHS Digital applied the model to medical records of NHS patients in England and those identified as being at an increased risk of dying from COVID-19 were added to the Shielded Patient List (SPL).

This approach was ground-breaking as there was no precedent for applying a model to patient records to identify individuals at risk on such a scale. Before the development of QCovid®, the SPL had been based on a nationally defined set of clinical conditions and local clinician additions. People added to the SPL through application of the QCovid® model were prioritised for vaccination and sent a detailed letter by DHSC advising them that they may want to shield.

The QCovid® model was peer-reviewed and externally validated by trusted, statistical bodies such as the ONS and the results and the QCovid® model code were published. 

What we found from reviewing QCovid®

In testing the lessons from the review of the grading models in 2020, we found that some lessons were not as relevant for QCovid®. For example, the lesson about the need for being clear and transparent on how individuals could appeal any decisions that the algorithm might have automatically made was less relevant in this review. This is because, although individuals were added to the SPL through the model, shielding was advisory only, and individuals (or GPs on their behalf) could remove themselves from the list. Finding lessons that were less relevant in a different context is to be expected as every algorithm or model will differ in its development, application, and outcomes.

As part of this review, we did identify one additional lesson. This concerned how often the underlying data should be refreshed to remain valid in the context of the algorithm’s use and appropriateness, especially if the algorithm is used at different points in time. This was not relevant for the review of grading models as they were only intended to be used once. However, in a different situation, such as the pandemic, where new information is being discovered all the time, this was an important lesson.

What do we plan next?

We found that the framework developed for the review of grading models proved to be a useful tool in helping to judge whether the QCovid® model was likely to command public confidence. It provided assurance about the use of the model and stood up well under scrutiny. Additionally, working on this review has helped us to understand more about QCovid® itself and the work behind it. QCovid® provides a great example that models and algorithms can command public confidence when the principles of Trustworthiness, Quality and Value (TQV) are considered and applied. In terms of how we will use these findings going forward, we have updated our algorithm review framework and this example will feed into the wider OSR work on Guidance for Models as it continues to be developed this year. 

I really hope this work will be useful when we come across other algorithms that have been used to produce statistics and also that when we incorporate it into our Guidance for Models that others will benefit more directly too. So, this concludes my first blog in my Methods role at OSR, and in fact, my first blog ever!

Guest Blog: Challenges and Opportunities for Health and Care Statistics

The COVID-19 pandemic has thrust health and social care statistics into the headlines. Never has there been more scrutiny or spotlight on health statistics – they are widely quoted, in Number 10 briefings, in the news, across social media, on Have I Got News for you… and everyone (it seems) is an expert.  Nearly 2 years on from the first news reports of the ‘coronavirus’, the public appetite for data and statistics has continued to grow. This has created new challenges for health and care statistics producers, as well as highlighting existing areas for improvement, as set out in the recent Office for Statistics Regulation’s COVID-19 lessons learned report.  The report noted the remarkable work of statistics producers, working quickly and collaboratively to overcome new challenges.

I joined the Department of Health and Social Care early in the pandemic, first leading the Test & Trace analytical function and for the last year as the department’s Head of Profession for Statistics. I have experienced these challenges first-hand and have been impressed throughout by the professionalism and commitment of colleagues across the heath sector to produce high quality and trustworthy statistics and analysis.

One of the recommendations of the OSR report (lesson 7) calls for us to build on the statistical achievements of the last two years and ensure stronger analytical leadership and coordination of health and social care statistics. I reflected at the beginning of the pandemic that it was hard to achieve coherence, given the number of organisations in England working rapidly to publish new statistics. We have made substantial improvements as the pandemic has gone on, the COVID-19 dashboard one of many notable successes, but I want to go further, and apply this to other areas of health and social care.

To address this, I have convened a new Health Statistics Leadership Forum alongside statistical leaders in the Office for Health Improvement and Disparities, NHS England/Improvement, NHS Digital, NHS Business Services Authority, Office for National Statistics, and the newly formed UK Health Security Agency. The forum is chaired by the Department for Health and Social Care in its overarching role and brings together Heads of Profession for statistics and lead statisticians from across the health statistics system in England.

We will use this monthly forum to ensure collaboration across all our statistical work. And we have a broader and more ambitious aim to build a culture (that transcends the complex organisational landscape) which values analytical insights, supports innovation and ensures there is a clear, joined up narrative for health statistics in the public domain.

We have set five immediate priorities

  1. Coherence in delivery of advice and statistics
    We will work collaboratively to ensure that our statistical portfolios are aligned, and we provide complimentary statistical products – working in a joined-up way across the system
  2. Shared understanding of priorities
    Ensuring health statistics address the highest priority areas, are relevant and useful for public debate and provide clear insight to inform decision making at the highest level.
  3. Consistent approach to transparency
    We will ensure alignment of both our internal and external reporting so that the right data is quoted in statements and policy documents – clearly sourced and publicly available in line with the Code of Practice for Statistics.
  4. Shared methodologies and definitions
    We will have clear principles for coherence of methodologies and definitions, an expectation of common definitions where it makes sense to do so, and an escalation route via the forum for disagreement.
  5. Build a joined-up statistics community
    We will build a joined-up health statistics community through sharing our guidance on good practice, our approaches to induction, a shared seminar programme and annual town hall event, joint recruitment, managed moves, and secondments or loans.

Government statisticians have achieved so much as a community to provide statistics and analysis in really challenging times over the last two years, but there are lessons to learn and things we can do better.  I am confident that our Leadership Forum will ensure that we maintain this collaborative approach to delivery, and bring health statistical leaders together to make that happen.

Data makes the difference

This is a guest blog from Jonathan Smyth, Head of Communications and Fundraising at Action Mental Health.

As an organisation, Action Mental Health has long campaigned for better mental health services in Northern Ireland. Alongside partners in the sector, a key part of our campaigning included calls to produce a fully costed and properly resourced mental health strategy that would deliver real change for people in Northern Ireland. We were the only region of the UK without such a strategy despite being the region with the most need, something borne out by the fact that we have the highest prevalence of mental health problems in the UK.

In June 2021 then, we very much welcomed the announcement by Northern Ireland’s Health Minister – Robin Swann, MLA, of Northern Ireland’s first ever Mental Health Strategy, a ten-year vision that outlines three key themes encompassing 35 actions, as well as recognising the need to invest £1.2bn over the life time of the strategy to deliver its recommendations.

In addition to the new strategy, we very much welcome OSR’s in-depth review of mental health statistics in Northern Ireland, which has confirmed that existing statistics do not meet current user needs and sets out expectations in this area to make real change.

Across the many discussions and interactions, we have had, and continue to have with other mental health campaigners and professionals, one of the key things we hear is frustration at the lack of robust data and statistics around mental health and mental health service delivery in Northern Ireland. Given the obvious pressures on the health budget due to Covid it is vital that precious investment is not wasted and unfocused due to incomplete or false data.

We hear regularly from professionals about the challenges they face in navigating Northern Ireland’s fragmented services, which are often entirely different from area to area, or maybe they are simply described differently depending on postcode.

We’re also aware of the impact this has on our clients and the confusion and frustration it causes as they have to re-tell their story to many different healthcare professionals.

With this differentiation in service delivery comes issues with data collection – there is very little standardisation of data, across what is such a relatively small area, both in terms of geography and population. How then do we plan for better services and better outcomes if we don’t know what we are comparing from area to area? As an organisation trying to develop innovative new projects it is frustrating that there is no easily accessible source of data to ensure our valuable resources are properly focused on client need.

The lack of robust statistics in such a complex area can also present challenges in the digital age when misinformation can be spread so easily. Being able to vigorously challenge potentially damaging or worrying claims with evidence based, factual information is vital to protect public confidence and support public health messaging.

Our anecdotal evidence is supported by the findings of the newly published OSR (Office for Statistics Regulation) review of Northern Ireland’s mental health statistics which found:

  • The scarcity of robust mental health data in Northern Ireland has hindered the development of statistics and led to significant data gaps.
  • The lack of regional standardisation and a fragmented technology infrastructure has led to poor data quality, with limited consistency or comparability across the region.
  • Users find it difficult to locate official statistics across a dispersed landscape. Data accessibility could be improved.

In many ways these issues will be a fundamental challenge to the successful delivery of the new Mental Health Strategy. We need timely and robust data to underpin everything we do.

As that famous old business consultancy cliché goes:

“What gets measured gets done”

We have a unique opportunity with the new strategy in Northern Ireland to change how we support those with mental health issues, and robust and reliable data that targets investment and ensures better outcomes must be our goal.

You can find out more about Action Mental Health’s work by visiting our website or follow us on Twitter.

Glimmers of light for adult social care statistics

I was very interested in a recent Social Finance report on how to secure impact at scale. One of their points is that, if you want to see impact at scale, you need to be willing to seize the moment. Change arises when supportive policies and legislation fall into place, and when a new public conversation starts.

This idea – new policies, and new public conversations – made me think of social care statistics. It’s very tragic that it has taken the disastrous impact of the pandemic in care homes to focus attention on this issue, but there seems to be some potential for progress on the statistics now.

The background is that we’ve been shouting about the need for better statistics for the last couple of years. We’ve done so through reports on social care statistics in England , Scotland and Wales . We’ve done it through presentations and I’ve taken the opportunity to highlight it when I’ve given evidence at the Public Administration Committee in the House of Commons.

Certainly, we found some excellent allies in Future Care Capital and the Nuffield Trust, yet it has sometimes felt like we’re in the minority, shouting in the wilderness.

What were our concerns? Our research in 2020 highlighted that there were several challenges and frustrations related to adult social care data that were common to England, Scotland and Wales. Our report summarising the common features of the statistics across Great Britain highlighted four key needs to help both policymakers and individuals make better informed decisions about social care:

  • Adult social care has not been measured or managed as closely as healthcare, and a lack of funding has led to under investment and resourcing in data and analysis.
  • There is an unknown volume and value of privately funded provision of adult social care. Although data is collected from local authorities, this only covers activities that they commission and fund, which constitute a smaller proportion of total adult social care activity.
  • Robust, harmonised data supply to ensure comparable statistics from both public and private providers is problematic, as data collection processes are not always standardised. Furthermore, data definitions might not always be consistent across local authorities and other providers.
  • Data quality is variable within and across local authorities, with inconsistent interpretation of data reporting guidance by local authorities. This means that data isn’t always reliable and so users have difficulty trusting it.

As data issues go, as the pandemic has highlighted, there is not so much a gap as a chasm, with consequences to our understanding of social care delivery and outcomes.

Most people we’ve talked to, inside and outside the UK’s governments, recognise these issues. But to date there hasn’t been much evidence of a sustained desire to inject energy into the system to effect change.

Maybe, though, there are glimmers of light. Whilst this list is not meant to be exhaustive, I would like to draw attention to some initiatives that have caught my eye.

  • The first comes from an extremely negative space. That is the pandemic’s impact on those in care homes. Not only has the pandemic highlighted the importance of care and care workers, it has also led to much more interest in data about the care home sector. The Care Quality Commission and the Office for National Statistics (ONS) collaborated to publish timely information on the numbers of deaths in care homes , to shine a light on the impact of the pandemic for this vulnerable population. And DHSC has commenced the publication of a monthly statistics report on Adult social care in England to fill a need for information on the social care sector itself. This means that COVID-19 has resulted in people listening to analysts and statisticians when we raise the problem with social care data now. Of course, the questions people are interested in go well beyond COVID-19.
  • The Department for Health and Social Care’s draft data strategy for England makes a significant commitment to improving data on adult social care.
  • The Goldacre Review for data in England may present a further opportunity for improvement.
  • I was pleased to restore the National Statistics designation to the Ministry of Housing, Communities and Local Government’s statistics report about local authority revenue.
  • Beyond the pandemic, ONS is working in collaboration with Future Care Capital to shine a light on one of the biggest data gaps here: the private costs borne by individuals and families for care. And ONS has recently published estimates of life expectancy in care homes prior to the pandemic.
  • Adult social care remains high on the political agenda in Scotland, with the recently published independent review of adult social care by the Scottish Government and the inquiry by Scotland’s Health and Sport Committee.
  • The Welsh Government remains committed to improving the data it captures on social care .

It’s far too early to declare “problem solved”, but we ought to be optimistic about improvements to data as a consequence. We’ll be reviewing the actions currently underway as statistics producers react to the gaps in social care statistics highlighted by the pandemic and publishing a comprehensive report of our findings in the autumn.

What I do think is that there is an opportunity here – if statistics producers across the UK are willing to take it, we can anticipate much better statistics on this sector. And a much better understanding of the lives and experiences of citizens who receive, and provide, social care.

The people behind the Office for Statistics Regulation in 2020

This year I’ve written 9 blogs, ranging from an exploration of data gaps to a celebration of the armchair epidemiologists. I was thinking of making it to double figures, setting out my reflections across a tumultuous year. And describing my pride in what the Office for Statistics Regulation team has delivered. But, as so often in OSR, the team is way ahead of me. They’ve pulled together their own year-end reflections into a short summary. Their pride in their work, and their commitment to the public good of statistics, really say far more than anything I could write; it’s just a much better summary.

So here it is (merry Christmas)

Ed Humpherson

Donna Livesey – Business Manager

2020 has been a hard year for everyone, with many very personally affected by the pandemic. Moving from a bustling office environment to living and working home alone had the potential to make for a pretty lonely existence, but I’ve been very lucky.

This year has only confirmed what a special group of people I work with in OSR. Everyone has been working very hard but we have taken time to support each other, to continue to work collaboratively to find creative solutions to new challenges, and to generously share our lives, be it our families or our menagerie of pets, all be it virtually.

I am so proud to work with a team that have such a passion for ensuring the public get the statistics and data they need to make sense of the world around them, while showing empathy for the pressures producers of statistics are under at this time.

We all know that the public will continue to look to us beyond the pandemic, as the independent regulator, to ensure statistics honestly and transparently answer the important questions about the longer term impacts on all aspects of our lives, and our childrens’ lives. I know we are all ready for that challenge, as we are all ready for that day when we can all get together in person.


Caroline Jones – Statistics Regulator, Health and Social Care Lead

2020 started off under lockdown, with the nation gripped by the COVID-19 pandemic and avidly perusing the daily number of deaths, number of tests, volume of hospitalisations and number of vaccines. This level of anxiety has pushed more people into contacting OSR to ask for better statistics, and it has been a privilege to work at the vanguard of the improvement to the statistics.

To manage the workload, the Health domain met daily with Mary (Deputy Director for Regulation) and Katy, who manages our casework, so we could coordinate the volume of health related casework we were getting in. We felt it important to deal sympathetically with statistic producers, who have been under immense pressure this year, to ensure they changed their outputs to ensure they were producing the best statistics possible. It’s been rewarding to be part of that improvement and change, but we still have a lot of work to do in 2021 to continue to advocate for better social and community care statistics.


Leah Skinner – Digital Communications Officer

As a communications professional who loves words, I very often stop and wonder how I ended up working in an environment with so many numbers. But if 2020 has taught me anything, it’s that the communication of those numbers, in a way that the public can understand, is crucial to make sure that the public have trust in statistics.

This has made me reflect on my own work, and I am more determined than ever to make our work, complex as it can be, as accessible and as understandable to our audiences as possible. For me, the highlight of this year has been watching our audience grow as we have improved our Twitter outputs and launched our own website. I really enjoy seeing people who have never reached out to us before contacting us to work with us, whether it be to do with Voluntary Application of the Code, or to highlight casework.

As truly awful as 2020 has been, it is clear now that the public are far more aware of how statistics affect our everyday lives, and this empowers us to ask more questions about the quality and trustworthiness of data and hold organisations to account when the data isn’t good enough.


Mark Pont – Assessment Programme Lead

For me, through the challenges of 2020, it’s been great to see the OSR team show itself as a supportive regulator. Of course we’ve made some strong interventions where these have been needed to champion the public good of statistics and data. But much of our influence comes through the support and challenge we offer to statistics producers.

We published some of our findings in the form of rapid regulatory review letters. However, much of our support and challenge was behind the scenes, which is just as valuable.

During the early days of the pandemic we had uncountable chats with teams across the statistical system as they wrestled with how to generate the important insights that many of us needed. All this in the absence of the usual long-standing data sources and while protecting often restricted and vulnerable workforces who were adapting to new ways of working. It was fantastic to walk through those exciting developments with statistical producers, seeing first-hand the rapid exploitation of new data sources.

2021 will still be challenging for many of us. Hopefully many aspects of life will start to return to something closer to what we were used to. But I think the statistical system, including us as regulators, will start 2021 from a much higher base than 2020 and I look forward to seeing many more exciting developments in the world of official statistics.


Emily Carless – Statistics Regulator, Children, Education and Skills Lead

2020 has been a challenging year for producers and users of children, education and skills statistics which has had a life changing impact on the people who the statistics are about.  We started the year polishing the report of our review of post-16 education and skills statistics and are finishing it polishing the report of our review of the approach to developing the statistical models designed for awarding grades.  These statistical models had a profound impact on young people’s lives and on public confidence in statistics and statistical models.

As in other domains, statistics have needed to be developed quickly to meet the need for data on the impact of the pandemic on children and the education system, and to inform decisions such as those around re-opening schools. The demand for statistics in this area continues to grow to ensure that the impact of the pandemic on this generation can be fully understood.

OSR, your critical friend: working with us for the first time

In March 2020, the NHS Business Service Authority (NHSBSA) contacted us to assess its Prescription Cost Analysis: England statistics. NHSBSA is a new official statistics producer, with a change in ownership of the publication of these statistics prompting this assessment. Earlier this month, we published the Assessment Report on the NHSBSA’s Statistics on Prescription Cost Analysis in England.

It was our first time working with NHSBSA, and for our regulator, Vicky Stone, it was her first time leading an assessment. For this blog, we asked the Lead Official for Statistics at NHSBSA, Michael Cole, what he thought about working with us and asked Vicky for her take on leading an assessment for the first time.

For Michael: Why did you ask OSR to assess the statistics?

Michael: “Volunteering to be assessed by OSR might seem an unnecessary distraction when we’re all so busy, but we did, and I’ll tell you why. Our purpose at the NHS Business Services Authority is to be a catalyst for better health. This means we work in collaboration with our stakeholders, customers, and partners across the health and care system. With the intention to innovate, try new things and explore different ways of working. Publishing effectively is a crucial part of this.

This purpose was also the motivation that saw us start a journey. Moving from being a provider of data for Official Statistics, to a producer of Official Statistics. We recognised that through using our expertise we can better tell the story of the data we hold. It’s the job of my team here at the NHSBSA to produce Official Statistics that serve the public good; a goal that we share with OSR. To aid understanding of the issues of today to support better decision making. Asking OSR to assess us made absolute sense, they’re the organisation that has the statutory obligation to ensure that statistics are produced and disseminated for the public good.”

 For Vicky: What was it like to lead your first assessment?

Vicky: “Initially quite daunting, but also a great opportunity for me to build my confidence and knowledge as a regulator. With the support, help and guidance from a more experienced colleague, it was truly a team effort in assessing these statistics. I really enjoyed making connections with NHSBSA and listening to a wide range of user views as part of our engagement exercise. Speaking with others really helps us to understand where improvements can be made. The main challenge for us as a team was time and resource given the timing of the assessment (April – October during the COVID-19 pandemic).”

For Vicky: What did you learn?

Early engagement with statistic producers is really important – we initially met with NHSBSA at the launch of its publication strategy in July 2019 prior to us starting the assessment. Building those foundations helped us to have open and honest conversations with NHSBSA. That engagement continued throughout the assessment, and the team at NHSBSA were really positive. We had a shared vision – improving the value of the PCA statistics.

For Michael: What would you say to anyone thinking of working with OSR?

Michael: “Working with OSR might be met with initial apprehension. A preconception even, that OSR want to trip Official Statistic producers up, unearth issues, or find fault when there is none. Having been through an assessment I can say this certainly isn’t the case. Expect OSR to be a critical friend. Expect OSR to be supportive. Expect OSR to ask questions. Expect OSR to present valid challenge that is absolutely vital to ensure National Statistic designation is appropriate. After all, National Statistics status tells users statistics comply with the Code and meet the highest standards of trustworthiness, quality and value. We shouldn’t expect anything less.

I’d encourage all producers to work with OSR. I’d emphasise work with. Starting off with the mindset that an assessment by OSR is more than an exercise of providing evidence is key. Approaching an assessment with genuine desire to collaborate is vital. Take the opportunity to innovate and ensure your official statistics contribute to the collective mission and objectives of the statistical system.”


If you’d like to work with us, or if you have any questions about our assessment process, please contact us.

Why trust and transparency are vital in a pandemic

During the coronavirus pandemic we have seen statistics and data take an increasingly prominent role in press conferences, media interviews and statements. Governments across the UK have used data to justify decisions which impact on everyone in society, including restrictions on retail, travel and socialising.

In using these data we have seen examples of good practice and a commitment to transparency but remain disappointed that these practices are not yet universal. Transparency is an important aspect of public trust in government and the decisions it makes. So what should governments do?

1. When governments quote data in statements and briefings these data should be accessible to all and available in a timely manner.

We have recently seen high profile briefings drawing on important data. For example, on 31 October 2020 the Chief Medical Officer for England and the Government Chief Scientific Advisor presented data in a series of slides prior to the Prime Minister’s announcement of new restrictions coming into force in England on 5 November. We welcome the fact that the sources for the data used in the slides were published – albeit three days after the slides themselves. It is good that it is now standard practice to publish the sources for data quoted in No 10 coronavirus conferences and in future we hope to see the information consistently published at the same time as the slides.

In Wales, a ‘firebreak lockdown’ period was announced by First Minister Mark Drakeford in a press conference on 23 October 2020. He presented data through a series of slides which were then shared via Twitter. While it is good that the slides were made available it is important that those who want to can find the data and understand the context. This could be more easily achieved if the slides and links to the data sources were published on an official website in a consistent way. It would also be helpful for more information to be provided on the basis of the comparisons made, for example, whether it is appropriate to compare Torfaen with Oldham.

It will not always be possible to publish information before it is used publicly. In these cases, it is important that data are published in an accessible form as soon as possible after they have been used, with the context provided and strengths and limitations made clear. For example, when Public Health England started publishing Local Authority level data following the announcement of the first local area lockdown in England and when Scottish Government and Public Health Scotland committed to publication of unpublished statistics on routine serology (antibody) testing.

2. Where models are referred to publicly, particularly to inform significant policy decisions, the model outputs, methodologies and key assumptions should be published at the same time.

There are many models across government which are used primarily for operational purposes. In cases where outputs from these models are quoted publicly it is our expectation that the associated information, including key assumptions, is also made available in an accessible and clear way.
In the press conference on 31 October this was not the case. The Prime Minister referred to the reasonable worst-case scenario – a model set up to support operational planning. However, the data and assumptions for this model had not been shared transparently.

3. Where key decisions are justified by reference to statistics or management information, the underlying data should be made available.

During times of rapid change there is an increased need for timely and detailed management information. It is important that ministers have up-to-date information to inform governments’ responses to the coronavirus pandemic.

However, information which is relied on and referenced for key decisions should be available to the public. One of the main criteria for decisions in England on local area movement between tiers and national restrictions from 5 November was capacity within the NHS. Information on hospital capacity is available in Wales and Northern Ireland, but is not currently routinely published in England or Scotland.

Timely and transparent publication of information negates the need for information leaks – which are the antitheses of the expectations set out in the Code of Practice for Statistics – and is vital to public understanding and public confidence in the government’s actions.

In summary, data should be published in a clear and accessible form with appropriate explanations of context and sources. It should be accessible to all and published in a timely manner. OSR has today published a statement outlining our expectations. Through this transparency governments can support trust in themselves and the decisions they make.