The trouble with measuring poverty

We have since published a Review of Income-based poverty statistics from the time of this blog’s release.

What does it mean to be in poverty? It’s a question that has been debated for a long time and is one of the reasons why measuring poverty is so difficult. There are many interest groups and think tanks who have covered this issue time and time again, such as the Joseph Rowntree Foundation and Full Fact.

The concept of poverty means different things to different people and to some extent, requires a judgement call to be made as to where to draw the poverty line. Generally speaking, being in poverty refers to when people lack financial resources to afford to meet their basic needs.

While it may be difficult to define, it is important for central and local governments to understand the prevalence and nature of poverty in the areas they serve so that they can put targeted support in place. This blog looks at what data is out there to measure poverty and highlights the work being done to improve the future evidence base on poverty.

So what is the best measure of poverty?

There is no right or wrong measure of poverty. Different measures of poverty capture different things, and trends in these measures can vary over time.

No single figure about poverty tells the whole story so context is really important when drawing comparisons of poverty over time.

There are four commonly used income-based measures of poverty produced annually by the Department for Work and Pensions (DWP) in its Households Below Average Income (HBAI) National Statistics publication:

  • Relative poverty (relative low income) – households which have less than 60% of contemporary median income
  • Absolute poverty (absolute low income) – households which have less than 60% of the median income in 2010/11 held constant in real terms
  • Both relative and absolute poverty can be measured on a before housing costs (BHC) or after housing costs (AHC) basis.

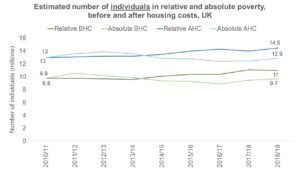
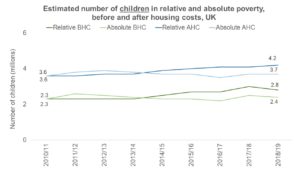
These four measures are published by children, pensioners, working-age adults and all individuals. The data below shows the latest figures for children and all individuals. Across all measures, we can see that the number of children in poverty has increased since 2010/11. For all individuals in poverty, the picture is more complicated as the total number in absolute poverty has seen a decrease in this time (by 100,000 individuals both before and after housing costs) whilst the number of individuals in relative poverty has seen an increase (from 9.8 million to 11 million before housing costs and from 13 million to 14.5 after housing costs).

Chart showing the estimated number of children in relative and absolute poverty, before and after housing costs, UK

Source: DWP Households below average income, 1994/95 to 2018/19

Chart showing the estimated number of individuals in relative and absolute poverty, before and after housing costs, UK

Source: DWP Households below average income, 1994/95 to 2018/19

As well as these four measures, DWP produces statistics on material deprivation. This is where an individual or household can’t afford certain necessities and activities that are measured by a basket of goods.

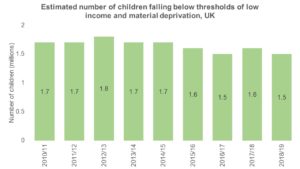
The DWP publishes estimates of the number of children falling below thresholds of low income and material deprivation in its HBAI statistics. The questions underpinning this measure were updated in 2010/11 and the DWP is clear that figures from the old and new suite of questions are not comparable. Since 2010/11, the number of children falling below thresholds of low income and material deprivation has fallen by 200,000.

Chart showing the estimated number of children falling below thresholds of low income and material deprivation, UK

Source: DWP Households below average income, 1994/95 to 2018/19

Material deprivation on its own is not widely used as a measure of poverty as it is not designed to measure low income. However, the combined measure of low income and material deprivation offers a wider measure of people’s living standards which can be used to look at elements of persistent poverty. This measure was the basis of one of the targets set in the Child Poverty Act 2010 aimed at reducing child poverty.

Outside the world of official statistics, there is another measure of poverty produced by the Social Metrics Commission (SMC). The SMC is an independent group of experts formed to develop a new approach to poverty measurement that both better reflects the nature and experiences of poverty that different families in the UK have, and can be used to build a consensus around poverty measurement and action in the UK.

It has been publishing its poverty measure since 2018 which is considered to be the most comprehensive measure of poverty available as it covers the depth, persistence and lived experience of poverty.

What more can be done to improve the evidence base on poverty?

The SMC has been working with the DWP to publish experimental statistics in 2020 that will look to take the current SMC measure and assess whether and how this can be developed and improved further to increase the value of these statistics to the public.

These experimental statistics will be published in addition to the HBAI publication, which will continue to produce the four recognised income-based measures of poverty highlighted earlier. The work on developing these statistics has been paused due to the Covid-19 pandemic but the DWP remains committed to carrying out this work.

Poverty remains a significant issue for the UK and has the potential to be of greater importance as we adjust to life following Covid-19. This is why we are launching a systemic review on the coherence of poverty statistics in Autumn 2020.

We will provide more information on the scope of the systemic review on our website later this year and we look forward to engaging with the public to understand how the quality and public value of official statistics on poverty can be improved, to help facilitate open and fair public debate.

The fact that there are different ways of measuring poverty should help build the bigger picture on poverty in the UK and should not be used as an excuse to be selective with data to support only part of the story. This is something the Chair of the UK Statistics Authority commented on back in 2017, when referring to the then Prime Minister’s comments on child poverty:

We do, however, feel that public debate would be enhanced if the Government indicated more clearly which measure or measures it places greatest weight on and that it was consistent in reporting progress against this measure. It is unhelpful if there is regular switching between what constitutes the key measure.”

Measuring poverty is complicated. There is no wrong measure but there is a wrong way of using the available measures – and that is to pick and choose which statistics to use based on what best suits the argument you happen to be making. It is important to look at all the data available and set the context when referring to statistics on poverty.

Consultation on priorities

Priorities for our 2017/18 Regulatory Work Programme

We welcome your views


On 24 November 2016, when I announced the newly strengthened and more visible regulatory function of the UK Statistics Authority, the Office for Statistics Regulation, I said that I would be changing a number of things about the way we work to have greater impact on statistics as a public asset.

One of the key changes that I have been introducing is to be more outward-facing and forward looking. In line with this ambition, I want to consult widely and regularly on our regulatory work programme. Today I am setting out our thoughts on priorities for 2017/18. I would welcome your views on these priorities, and also any additional ideas you may have about work we could undertake in the next year (and beyond) to promote improvement in the Trustworthiness, Quality and Public Value of official statistics.

The linked documents below provide more information about how to respond to this request with your views, together with a template to complete by Friday 31 March 2017. We aim to review your responses and publish our business plan by the end of April.

I hope you will take this early opportunity to influence our work programme, and I very much look forward to hearing from you

Ed Humpherson
Director General for Regulation
6 March 2017


Submitting your views now

  • Guidance on submitting your views
  • Proposals and template to be completed and returned by 31 March 2017

Sharing your ideas at any time

  • Use this template to submit ideas for our work programme at any time

The Office for Statistics Regulation

Today the UK Statistics Authority’s regulatory function is implementing a series of changes to the way the function operates, and moving forward from now we will be the ‘Office for Statistics Regulation’.

Statistics are a valuable public asset. But like any asset, they can be subject to misuse, not be maintained, or become obsolete. The prevention of these harms sits at the heart of the Authority’s strategy, and that’s why we are clarifying the Authority’s regulatory work through the establishment of a more clearly distinct Office for Statistics Regulation.

The purpose of the Office for Statistics Regulation is to enhance public confidence in the trustworthiness, quality and value of statistics. We will continue to set standards through the Code; to uphold those standards, celebrating when they are met and challenge publicly when they are not. At heart, we want to be champions of relevant public statistics in a changing world.

So this is a significant change – a clear statement of the importance of regulation through the creation of a distinct and visible new Office for Statistics Regulation. But the change of name is not meaningful if it’s not accompanied by regulatory decisions that reflect our ambitions.

We have several important outputs in coming weeks. First, when we look forward, we see ever-growing interest in the role of operational and Big Data. So today we are publishing further work on administrative data. Second, we will publish the first of our new format Assessment reports over the next few weeks. These reports focus much more on the key outcomes we want from statistics – that they are trustworthy, high quality and high public value. Third, in mid-December we will publish the conclusion of our Code of Practice stock take, which will set an ambition for the Code to be an enabler, not a barrier, of the highest public value in statistics. And we’ve got important new work coming out, for example on National Insurance numbers for adult overseas nationals, and on improving the system of health and care statistics in England.

On the use of statistics, we’ve been busy this autumn, commenting on the use of statistics on grammar schools; on clinical standards in health and on increases in health spending. I expect this activity to continue.

Our most powerful tools are not a set of formal sanctions or detailed rules, but three other tools: first; our public voice; second, the National Statistics designation as a brand indicating the highest standards; and third the Code itself as a way of establishing norms of professional behaviour in the production and communication of statistics. I think this distinctive approach is important, and I’d like to write another blog about it in a few weeks time.

We will also strive for improvement in our own work. The work we are publishing today on administrative data consists of an honest review of the experience of statistical teams across government as they implemented our standard on administrative data. We find much to learn from, and much to respect too in the excellent work of the Government Statistical Service.

This striving for improvement underpins the move to an Office for Statistics Regulation. We are making this change to improve, because we recognise that in the past the Authority’s regulatory work has not always had the impact it should have had; and because we care deeply about the role of statistics as a core asset for government and for society.

Scottish Official Statistics Conference

I recently attended the Scottish Official Statistics Conference, where I spoke about the value of official statistics and the deep commitment which lies at the heart of the Authority’s regulatory work. We seek to enhance the public value of statistics by increasing the appropriate use of statistics and the trustworthiness, quality and value of statistics themselves. This has become increasingly important in a changing world that creates and uses data at far faster rates than in the past.

My speech focused on whether official statistics can continue to be relevant in this changing world.  With threats to the value of statistics – coming from the misuse of statistics, obsolescence, and poor quality – can official statistics thrive, or are we victims of the art of the lie?

My simple answer is yes, official statistics can thrive… if we focus on the core principles of trustworthiness, quality and value.  If we produce statistics that are free from any vested interest, are the best available estimate of what they purport to measure, and are not just ‘collect and count’ but statistics that inform public debate, then official statistics will thrive.

As the Authority’s regulatory arm, our role is to act as a champion of official statistics. We already do a lot – we assess National Statistics, we oversee the Code, we speak publicly on misuse.

But that’s not enough. The recent Bean Review highlighted two weaknesses:

  • The role of regulation is lost within a confusing Authority identity.
  • The way we’ve done the work is too process-y, insufficiently focused on value of statistics in the broadest sense.

So we are going to address these weaknesses through creation of a new Office in the coming months, with a clearer identity and a much stronger purpose of public value.

We welcome your views on these developments. You can contact us via email at assessment@statistics.gsi.gov.uk.

The full speech from the Scottish Official Statistics Conference can be found here.

Changes for the Authority’s Regulation function

It is an exciting time for us in the regulatory team of the UK Statistics Authority as we work to enhance our role as the regulator of statistics. To maintain high levels of public value, statistics need to change to reflect changing society and commerce. We aim to move to be more transformational: more impactful, strategic, and proactive. Our ambition is to be an independent regulator that champions the power of statistics and supports public confidence in these statistics.

Our goal is to increase the public value of statistics by increasing the appropriate use of statistics and the trustworthiness, quality and value of statistics themselves.

This period of change and evolution for the UK Statistics Authority’s regulatory function is something which I am excited and enthused about. I recently said more about our developing plans to improve regulation and champion professional excellence and why I relish the opportunity in this magazine interview.

This enthusiasm is based in part on the progress we’ve already made. We have already started implementing changes – like our innovative work to define and embed standards for the quality of administrative data, and high profile work on CPIH and homelessness statistics – and we have put together a blueprint for how we can do more. Over the next few months we will develop and test our new approach to statistics regulation, gauging reactions from a range of stakeholders, and implementing further changes to our regulatory model.

I will be writing here regularly in the coming months to update you on these developments.

We believe strongly in the value of statistics to society and decision makers of all kinds. We welcome input from anyone with an interest in statistics about how we can achieve our ambition.