Annex A - Casework Summary: April 2020 to March 2021
How many cases did we receive?
A total of 1,269 cases have been considered by the Authority between 1 April 2008 and 31 March 2021 (see Figure 1). Between 1 April 2020 and 31 March 2021 (2020/21) the Authority considered 323 pieces of casework.
Figure 1: Cases considered 2008/09 to 2020/21
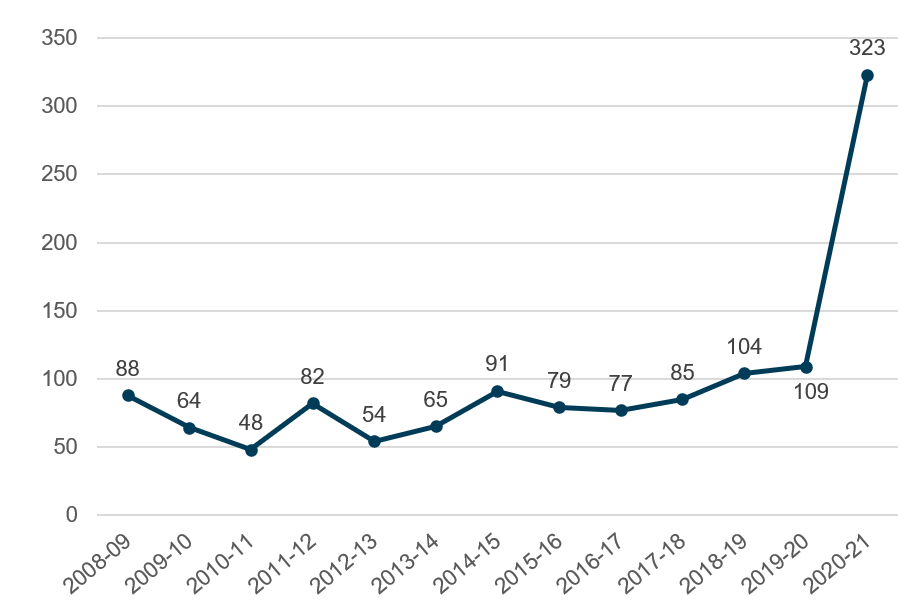
The data used to create this graph can be found in Tab 2 of this Excel Spreadsheet.
The month with the most cases in 2020/21 was May 2020 (49 cases). This was driven largely by issues relating to the COVID-19 pandemic, including statistics relating to deaths and COVID-19 testing.
The first half of 2020/21 was the busiest period for casework, at the height of the COVID-19 pandemic. Between April and September, the Authority handled 193 cases, with the remaining 130 between October and March.
Figure 2: Cases logged per month April 2020 – March 2021
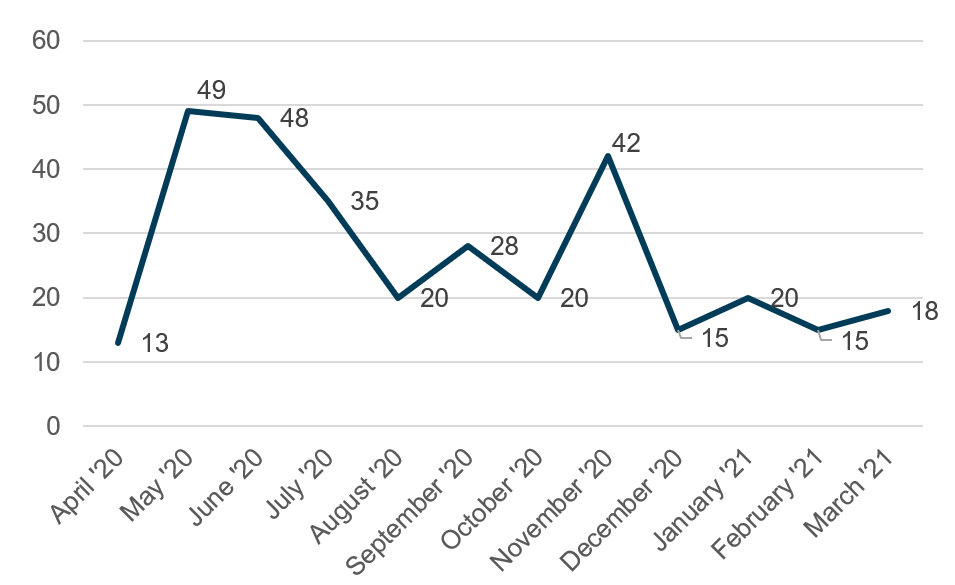
The data used to create this graph can be found in Tab 3 of this Excel Spreadsheet.
Back to topWhat was the nature of the issues?
This section summarises the types of issues raised through casework, comparing 2020/21 to the previous year. The types of issues considered remained broadly similar to the previous year, however quality, reliability and trustworthiness overtook use/misuse of statistics as the most common category of concern.
This year, the category with the highest number of issues raised was the quality, reliability and trustworthiness of statistics. This represents 156 cases (48%). These cases related to concerns about how well a set of statistics adhered to the expectations of the Code of Practice, which has three main pillars (Trustworthiness, Quality and Value). We expect all official statistics to adhere to these standards.
Figure 3: Percentage of cases considered by category of concern
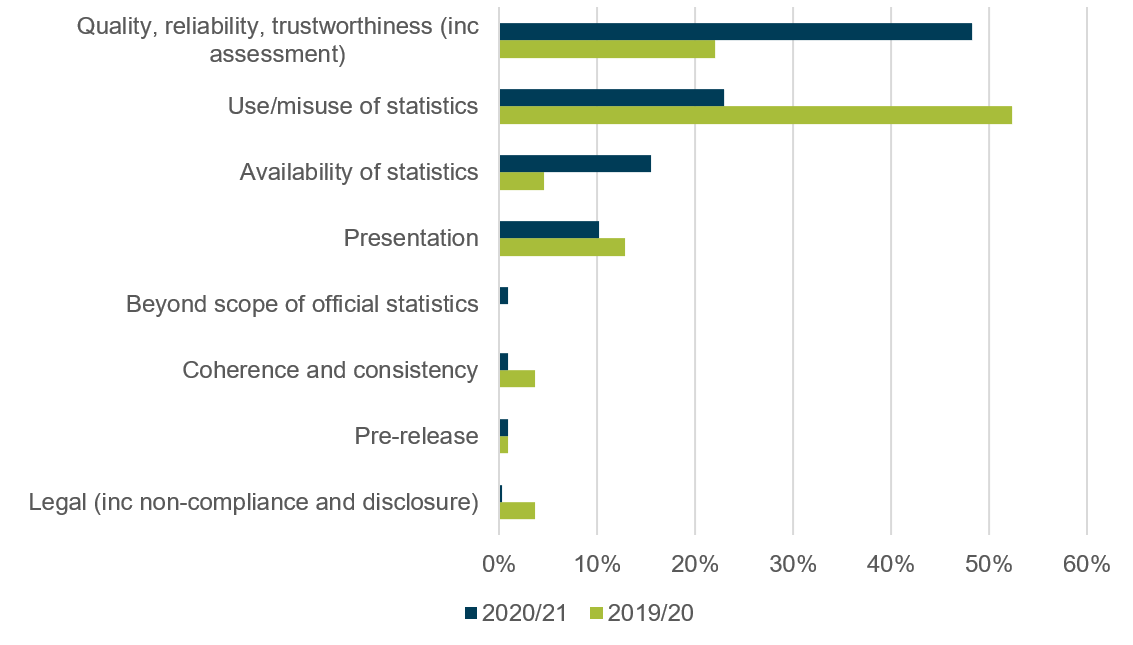
The data used to create this graph can be found in Tab 4 of this Excel Spreadsheet.
The next most common category, and the most common in the previous year, was about the use/misuse of statistics – 74 cases, 23%. This compares to 52% (57 cases) in 2019/20. These are often instances where statistics have been used in a way which someone considers potentially misleading, most commonly the use is by a public figure or in a press release from a public body. These types of issues can be picked up through individuals writing to the Authority, or through OSR’s media and social media monitoring. In 2020/21, of the 74 cases in this category the highest proportion came from members of the public (62%).
Back to topWhat were cases about?
Figure 5 shows the general themes of casework from 2020/21. These themes broadly correlate to the OSR domains.
Health and Social Care was the theme with the highest number of cases this year – 231 cases, 72% of total casework. The next most common themes represented 5% of cases each – Labour Market, Crime and Justice, and Population – these represent less than 20 cases each. In the previous reporting period (2019/20) the most common theme was Children, Education and Skills (30 cases, 28%) and Health and Social Care the second most common (18 cases, 17%).
Figure 4: Casework by theme
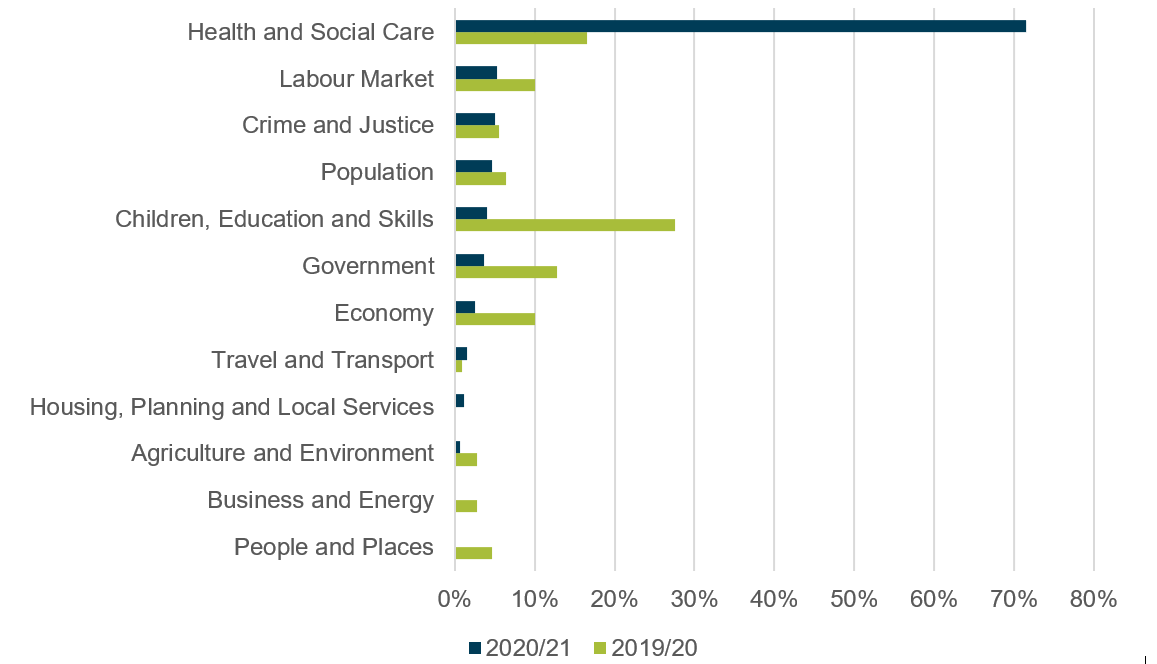
The data used to create this graph can be found in Tab 5 of this Excel spreadsheet.
Back to topHow long did it take to close cases?
This section of the report provides information on the time taken to close a case. This is the time taken between opening a case to closing a case. Over recent years, OSR has worked to improve processes so that more cases are turned around more quickly. However, it is important to note that this is never at the expense of making an informed judgment. Therefore, while closure times and response times are important, it is not the primary metric driving casework.
The report sets out the average time to close a case, giving the median and mean. The median is considered the headline measure as it best reflects the typical experience. In 2020/21 the median time taken to close a case was 10 days, compared with 13 days in 2019/20. The mean time taken to close a case in 2020/21 was 15 days. This number is higher than the median as it is more strongly influenced by a relatively small number of longer cases. The mean time taken to close a case in 2019/20 was 20 days.
The time taken to close a case covers internally and externally generated casework. The date of opening a case could be the date a concern is received from an external source or the date an issue is identified. The date a case is closed is the point at which the issue has been considered and any necessary action taken. For externally generated casework this will usually include a response to the person or organisation that raised the concern. Some longer-term follow up actions, as well as the impact of the casework, will be tracked separately.
OSR seeks to respond to all those who email or write whether or not it agrees with the concern raised. Casework can also result in correspondence with the individual or organisation a concern relates to. Some of the correspondence will be published on our website (or the UK Statistics Authority website where a letter was sent by the Chair) and some will be private.
Internally generated cases may not lead to any formal correspondence. For example, once a case has been considered no further action may be deemed necessary, or it could be resolved through informal engagement with stakeholders and departments.
These averages mask a lot of variation in response times. Table 1 shows that in 2020/21:
- 50% of cases were closed in ten days or fewer (45% in 2019/20)
- 88% of cases were closed within 30 days (79% in 2019/20).
- there were 11 cases that were closed more than 50 days after they were opened. Cases that take this long tend to be complex cases, or require lots of engagement with external departments or stakeholders.
Table 1: Days from opening to closing a case 2020/21
| Casework Closure Time (Days) | Totals | Cumulative Totals | Percentages | Cumulative Percentages |
|---|---|---|---|---|
| 0-10 | 162 | 162 | 50% | 50% |
| 11-20 | 80 | 242 | 25% | 75% |
| 21-30 | 41 | 283 | 13% | 88% |
| 31-40 | 18 | 301 | 6% | 93% |
| 41-50 | 11 | 312 | 3% | 97% |
| 51-100 | 11 | 323 | 3% | 100% |
There are a range of factors which will influence the time taken to respond, for example the profile of the issue, the number of organisations which need to be engaged and the type of issue being considered. Table 2 shows the average days taken to close a case by type of issue (median and mean).
Table 2: Average days to close a case by issue type
| Issue type | Count of cases | Median days to close a case | Mean days to close a case |
|---|---|---|---|
| Availability of statistics | 50 | 6 | 11 |
| Beyond scope of official statistics | 3 | 10 | 8 |
| Coherence and consistency | 3 | 7 | 7 |
| Legal (inc. non-compliance and disclosure) | 1 | 47 | 47 |
| Pre-release | 3 | 9 | 8 |
| Presentation | 33 | 8 | 14 |
| Quality, reliability, trustworthiness (inc. assessment) | 156 | 12 | 17 |
| Use/misuse of statistics | 74 | 12 | 13 |
OSR aims to send an acknowledgment of any correspondence within one working day, for longer running cases updates will be provided as the work progresses.
Unfortunately, due to the process used to archive older casework data the time to reply is not available and so median values for years prior to 2016 are not available. Additionally, prior to 2018 no date for closing a case was recorded in cases where a reply was not sent out. These combined issues mean that limited data are available for examining changes across time.
It should be noted that the time to reply and time to close (Table 3) are not directly comparable as not all cases receive a direct reply; as above, some internally-generated cases are closed with no further action or closed with informal action, such as discussion with a producer department. ‘Median time to reply’ represents the subset of cases to which a written reply was sent whereas ‘Median time to close case’ is the average closure time for all cases opened by OSR.
Table 3: Median days to reply or close a case by year
| Year | Median time to reply | Median time to close case |
|---|---|---|
| 2016-17 | 23 | [data not available] |
| 2017-18 | 21 | [data not available] |
| 2018-19 | 25 | 20 |
| 2019-20 | 13 | 13 |
| 2020-21 | 11 | 10 |
Who raised the issues?
This section summarises how casework was initiated including which groups raised casework.
We categorise these as either internal (i.e. through OSR’s own monitoring) or external, and then external cases are broken down further by a series of categories e.g. members of the public.
Of the 323 cases considered in 2020/21, the highest proportion of cases came from members of the public (172 cases, 53%). This is a substantial increase on 2019/20 where casework from the public represented 27% of all cases. Internally generated casework made up 16% of all cases (51 cases), a smaller proportion but higher number than in 2019/20 (39%, 43 cases).
Figure 5: Casework by source

The data used to create this graph can be found in Tab 6 of this Excel Spreadsheet.
Health and Social Care Casework
This year, of the 323 total cases, 231 (72%) of these related to Health and Social Care, with 97% of those (225 cases) related to the COVID-19 pandemic.
The majority of cases in the Health and Social Care theme were received from members of the public (56%).
The median closure time of health and social care related casework was eight days (mean 13 days). Within this, 56% of cases were closed in 10 days or fewer, and 90% were closed in 30 days of fewer.
Internally generated casework
Of the 51 internally generated cases, 13 cases led to some form of correspondence, 28 leading to informal action such as a discussion with a department. One case was transferred to another department, and the remaining nine cases led to no further action.
82% of internally-generated casework was in relation to the COVID-19 pandemic.
Government and Parliaments
The Authority received nine cases from members of Parliaments in the UK and Devolved administrations, and one case from a parliamentarian’s office. This includes cases raised by current members of Westminster and Scottish Parliaments; there were no cases raised by members of the Welsh or Northern Irish Parliaments in 2020/21. This year, there was an even split between Westminster and Scottish Parliaments with five cases each. There were also two cases from local government. In ten of the 12 total cases (83%) the Authority’s response was published.
The most common theme of the casework raised by these groups was health and social care – 7 cases, 58% – all of which were related to data and statistics on COVID-19.
In 2020/21, Sir David Norgrove wrote publicly to parliamentarians on 12 occasions relating to nine separate interventions. These were sent to five Members of Parliament (MPs), four Members of the Scottish Parliament (MSPs), and one Member of the Senedd (MS) – however the latter was related to an intervention in the previous reporting period (2019/20).
Casework discussed in parliament
During the period from 1 April 2020 and 31 March 2021 Authority interventions have been mentioned in the House of Commons and House of Lords 14 times. There was one mention of an intervention during this period in the Scottish Parliament. There were no mentions of the Authority, OSR or our interventions in the Welsh Parliament.
Annex B provides further details of references to Authority interventions in Parliaments within the UK, including excerpts from Hansard and the Official Report.
Back to top