Time doesn’t stand still

In light of our first change to the Code of Practice, which relates to the release times of official statistics, and gives producers the opportunity to release statistics at times other 9.30am, where they and we judge that this clearly serves the public good, our latest blog sees Penny Babb – Head of Policy and Standards – look back over the first four years of the Code of Practice and consider its impact.

In some ways, time seems to have stood still over the last couple of years. But in other ways, I’m amazed it is only four years since we published Edition 2.0 of the Code of Practice for Statistics – how time has flown! 

As I contemplate what the impact of the Code has been since we launched it in February 2018, my abiding sense is that the heart of the Code has never been better understood or more comprehensively applied. I know I’m biased, much like a proud parent sharing the latest pics of their child’s exploits, as I was closely involved in writing the Code and am OSR’s lead on its guidance.  

I’m not sure there could have been a more profound test of the Code than statisticians needing to turn their work on its head and seemingly perform miracles – bringing new meaning to ‘vital statistics’. How easy it would have been to say in March 2020 that the ‘rule book’ needed to be ripped up as the world had changed.  

Instead, analysts in the UK had a firm guide that supported and enabled them to make new and challenging choices – what to stop, what to change. How to better speak, explain, reach out to the massive audience with an insatiable appetite for numbers, to make sense of the unknown. 

Underpinning their decisions were Trustworthiness, Quality and Value – the framework of our Code. For each dilemma faced, the answer lies in thinking TQV:  

  • What should I release – what information is needed right now to support decision making?  
  • How should I release it – how can you ensure that the public retains confidence in the statistics and the people releasing them?  
  • But there’s no time for ‘full’ QA – what information do you have confidence in that will not mislead? 

Ultimately the Code of Practice is not a rule book but a guidebook. 

Very little in the Code is a directive. One exception has been the practice setting out the time of release of official statistics as 9.30am (T3.6). Today we are changing this practice following our three-month consultation in autumn 2021 and conversations with producers, users and other stakeholders. With a focus on what is prime in enabling the statistics to best serve the public good, producers can now consider whether there is a need to release their official statistics at a time other than 9.30am.  

There is nothing special about this specific time of day. The main characteristic is that it is a standard time across all official statistics producers in the UK that helps ensure consistency and transparency in the release arrangements and protects the independence of statistics. This is an essential hallmark of official statistics, and a norm that we continue to expect and promote. 

However, as the pandemic clearly showed, there are some situations when a producer may sensibly wish to depart from the standard time. The new practice enables greater flexibility, but a release time should still depend on what best serves the public good.  

We will continue to protect against political interference and ensure the public can have confidence in the official statistics. The final decision on whether an alternative release time is used will be made by the Director General for Regulation – the head of the Office for Statistics Regulation. All applications will be listed in our new table – it will include rejections as well as cases where the application was approved. 

And there may be further changes to the Code of Practice to come this year. For example, our review of the National Statistics designation has already proposed changing the name of experimental statistics. So, watch this space for further developments. And if you have any reflections on the Code of Practice, please feel free to send them to regulation@statistics.gov.uk

Launching our consultation: We want your views

As a regulator, we want to be as helpful as we can to producers of statistics to enable the release of valuable information, while also setting clear standards of practice. In the pandemic we supported producers by granting exemptions to the Code of Practice for Statistics to enable some statistics to be released at times other than the standard time of 9.30am.

Market sensitive statistics could no longer be released after the usual lock-in briefings, so we agreed for them to be released at 7am. This has meant that the lead statisticians have been able to speak in the media and explain the latest results.

We also enabled some statistics related to COVID-19 to be released later in the day as soon as they could be shared publicly with sufficient quality assurance. It has meant for example that both the Coronavirus infection survey bulletins and the Public Health Scotland COVID-19 weekly report for Scotland are released at noon.

Having a specific time of release has helped ensure consistency in release and grow confidence that official statistics are truly independent of political preferences and interference. The pandemic has brought to light how important timely statistics are, and the huge demand has meant that release timings have had to change so that the statistics remain relevant and useful to the public.

As we look beyond the pandemic, we have been considering whether we should amend the Code of Practice to enable more flexibility for producers but at the same time keep the benefits of consistency and protection against interference. We are grateful to everyone who has shared their views with us in our discovery phase. It has helped us consider a range of issues.

Consultation

We are pleased to announce that a 12-week consultation will begin on 28 September 2021, ending on 21 December 2021. Our consultation paper will set out some proposals on release approaches that look to maintain the benefits of standard release times but also support some greater flexibility. The Authority will carefully consider the responses before deciding on its preferred release practice.

We encourage you to consider the suggestions and to share your views with us.

The Code Pillars: Trustworthiness is about doing things differently

Trust can seem a no-brainer. It may seem so obvious, that of course it matters. It has often featured as the guiding aim of many a strategy for statistics.

I spend much of my time explaining about the Code of Practice for Statistics and our three pillars. I think of Quality as being the numbers bit – getting the right data, using the right methods. I think of Value as being why it all matters, making sure to serve the public and society. And Trustworthiness? Well, Trustworthiness for me is a lot like reputation – as Warren Buffett once said:

“It takes 20 years to build a reputation and five minutes to ruin it. If you think about that, you’ll do things differently.”

So, the Trustworthiness pillar is about ‘doing things differently’ – for analysts and their organisations. You can’t expect just to be trusted – you must earn it.

You have to behave honestly and with integrity – you can show that in the way that you use numbers. Anyone who spins data to make themselves look good, or cherry picks the numbers that tell the best story, will reveal themselves to be untrustworthy. But those that set out the facts plainly and objectively will be seen as someone to be trusted.

How you handle data and show respect to people and organisations giving their personal information can also prove that you are a safe pair of hands. But if you are seen to lose people’s data, or share it inappropriately, you’ll probably find people are not willing to share their information with you again.

And the way you release information matters – if you give any sense of being under the sway of political opportunism, the credibility of your statistics will be harmed.

So why isn’t the pillar called ‘Trust’ if that is what we are after?

Well, the answer is thanks to the seminal work of philosopher Baroness Onora O’Neill. She said that focusing on trust is fruitless – instead, you need to demonstrate that you are worthy of trust.

Basically, you can’t force someone to trust you. You can only show through the way you behave, not just once, but repeatedly, that you are honest, reliable, and competent:

  • tell the truth
  • do what you do well
  • and keep on doing these

Being reliable in these ways will mean that people will come to trust you. But the only bit you can do is show you are worthy of trust.

So, if you reflect on your reputation for being trustworthy and you want to be sure to keep it, do things differently.

Here are some case studies on our Code website that illustrate some ways that statistics producers show their Trustworthiness:

Looking back to look forward

Learning from the history of the National Statistics designation

While working on our review of the National Statistics (NS) designation I have wondered about the history of the term ‘National Statistics’ and about the designation itself. I had a pretty basic question I wanted to unravel: what does ‘national statistics’ mean?

I know how we use it now, in relation to the legal definition of having demonstrated full compliance with the Code of Practice for Statistics through the process of Assessment – but the two words have a degree of ambiguity. I wondered about the original intention and meaning and how can that help us going forward, in understanding what we need from the NS designation now. I found that there were three levels of meaning – about the statistics, about the process to produce statistics, and about the system itself. The history of National Statistics designation is summarised in these  flow charts. They give the developments over the past 30 years (in grey in the flow charts), highlighting some key observations about National Statistics in the literature.

In the early 1990s the Citizens Charter for open government, which introduced the move towards greater transparency in public policy, focused on the statistics themselves in describing official statistics as national statistics:

“They provide an objective perspective of the changes taking place in national life”.

A few years later, the Framework for ONS, which established the new Office for National Statistics in 1996, described them as informing “Parliament and the citizen about the state of the nation”. So the statistics were seen as being about the ‘nation’, for the citizen and not just for government.

As I looked across this potted history of National Statistics, it struck me that the concept of ‘national statistics’ evolved to reflect the full statistical process for preparing and publishing the statistics. This development in thinking is reflected in this quote from the ‘Statistics – a matter of trust’ green paper:

“National Statistics, that is the work supporting the production of statistics intended for public use”.

And in the green paper, we get the first mention of the term ‘National Statistics designation’:

“It would be natural for all outputs designated as part of National Statistics to be clearly marked as such”.

This approach is endorsed in the subsequent white paper, ‘Building trust in statistics’, in which the designation is formalised:

“The government does agree that it is essential to inform users of the quality of National Statistics so that they can assess their appropriateness for the intended use”.

But there is a third level of meaning for National Statistics that is represented here – the statistical system itself. Its scope is set in the white paper, as covering the whole of government, including the devolved administrations. The role of the National Statistician is created, with responsibility for the professional quality of National Statistics across the organisations in the UK. A common set of standards must be applied, as set out in the NS Code of Practice. The logo of National Statistics is also introduced, essentially as a ‘kite mark’ for the statistics. And the Statistics Commission was set up to oversee the statistical producers.

In the subsequent 20 years that followed, the system went through various reviews whose findings are helpful to us now. The legal framework we have now came from the first of these reviews by the Statistics Commission in 2004, reflecting their strong view that independence needed to be grounded in statistics legislation. The Statistics and Registration Service Act 2007 has this at its heart – the importance of statistics that serve the public good.

The Statistics Commission had some insights that it raised in its review of National Statistics that feel equally relevant now – they chime with feedback we received in our exploratory review. The Commission challenged the distinction between official statistics and National Statistics and recommended it be abandoned. It made the case for a kite mark – a ‘quality labelling scheme’:

“Users of statistics want a quality stamp that tells them that a particular statistical report has been prepared professionally and impartially and that a robust set of principles has been respected. However, it is less clear that adherence to the Code of Practice is itself the appropriate test to apply”

The Code Stocktake, beginning in late 2015, was an important review that collated huge insight across the stakeholder spectrum and was critical in informing the development of the refreshed Code of Practice. It was also important in helping shape the Office for Statistics Regulation, created from the Monitoring and Assessment Team of the UK Statistics Authority in 2016. The Stocktake made recommendations about focusing on the most valuable statistics in relevant groupings it called ‘families’ and suggested a ‘shelf-life’ for the NS designation.

Around the same time was the Bean review into economic statistics from ONS and also the governance of the statistics by the UK Statistics Authority. It recommended a more nuanced approach to the designation, such as looking at the benefits of score cards or having concise commentary with the statistics about their quality.

So, some important questions have been raised over the past 15 years about National Statistics and the designation. We are reflecting on these insights as we enter the second phase of our NS Designation review. We have established a steering group to help guide us and we are now beginning a series of projects to look into what we can learn from other regulators, thinking more broadly about rating and communicating judgements, what information different audiences require about the provenance and quality of the statistics, such as helping to inform decisions on whether to use the data.

We will provide further updates on these developments over the coming months. We also hope to begin some virtual discussions about the designation so please do email me at penny.babb@statistics.gov.uk if you are interested in joining the conversation.

Breaking boundaries – giving non-official data a stamp of approval 

What is it you think of when you come across some new information on social media? If you are like me and a bit of a sceptic (or should that read ‘sensibly cautious’?), the first thought is ‘What’s the source? Is it someone I trust?’

That can be the same with buying food in the supermarket. I’ll probably look at the packaging first and decide if it is a company I like. Then I might look at the ingredients and decide if I am OK with the amount of fat, sugar and additives, and see if it is giving me the nutrition I am needing.

So, to start with I am thinking about the provenance of the product, and my second step is to consider the fitness of the product to meet my needs.

And we need to take the same approach when we think about whether to use some data – find out about provenance and fitness for purpose.

In deciding the suitability of the source, you will want to think about:

  • Who collected the data?
  • Is it a trustworthy organisation?
  • Is it authoritative and independent?
  • Is it open and transparent?

We often take short cuts when we are making decisions – we look for clues to help us make quick choices. One of them can be recognising a familiar brand. In our recent exploratory review looking into the designation of National Statistics we asked two focus groups about how they decide whether to use some statistics – what influences their choice? It was interesting to see how they responded to statistics published by the Office for National Statistics or by other crown bodies such as government departments. Their immediate reaction was to trust the data. In fact, they said the logo of the crown itself would make a good logo for official statistics. It was something they recognised and gave them confidence.

The brand of an organisation publishing statistics can have a powerful impact on someone deciding to use the data. But it is important to not just rely on their brand – discerning users need easy access to information that helps show whether the organisation is trustworthy.

Users may quickly decide that the source is one they have confidence in – the critical information they want to know is about the quality of the data. Some questions they should ask to decide if the data are fit for a particular purpose are:

  • What are the data characteristics?
  • Are the data in their raw form or adjusted?
  • How representative and reliable are the data?
  • How well do the data match the concept I want to measure?
  • How relevant are the data to my purpose?

Again, prominent information that helps users understand quality is central to making a choice to use the data. The publisher of the statistics needs to simply explain about the strengths and limitations, to help the users decide whether the statistics are the right ones for them. And if the data end up being the only ones that are anywhere close to what they want to measure, this helps the users have a good appreciation about the limits of what the data can tell them. Oftentimes not just anything will do. Never forget – garbage in, garbage out!

Provenance and fitness for purpose rely on the trustworthiness of the producer and the ways that they work, the quality of the data and soundness of methods, and on the efforts taken to ensure the relevancy of the statistics. In OSR we summarise these as TrustworthinessQuality and Value – the three pillars of the Code of Practice for Statistics.

The Code sets the professional standards for all official statisticians – it is why users can have confidence that the statistics produced in government departments are independent of political interference. It is our job as the regulator to hold the producers of official statistics to account.

But what about non-official statistics? Do the same standards apply? In short – they can. We introduced a scheme in 2018 alongside the publication of the Code of Practice that we call ‘voluntary application’. It is where an organisation releasing non-official data elects to hold themselves to the three pillars of the Code of Practice.

We ask them to make a public commitment. They do this by setting out how they show their adherence to Trustworthiness, Quality and Value – what it looks like in practice – and we recommend they publish a statement of compliance. We maintain a list of adopters of the Code pillars on our Code of Practice website, with a link to the published statements of compliance that we have reviewed.

So far there are 24 sets of statistics listed on our website. And it is growing. We have an active community of practice in which organisations and analysts can share their experiences and learn from each other.

Some of the organisations are crown bodies and release official statistics – these organisations produce a wide range of data and analysis, much of which is not released as official statistics. Voluntarily applying the Code is a powerful way of bringing the same, common-sense standards to all areas of these organisations.

Many organisations in the list are not government departments and do not publish official statistics. The list includes the Financial Conduct Authority, the Universities and Colleges Admissions Service – UCAS, the Scottish Fiscal Commission, the Greater London Authority, Ipsos MORI and the Social Metrics Commission.

Applying the three pillars of Trustworthiness, Quality and Value provides a powerful thinking tool for organisations – it helps them learn together about the pillars, reflect on the nature of their statistical or analytical practices and see how they show the pillars, consider ways of improving or extending their practices, and then make the public commitment to continue to work to these standards. It is a powerful statement – not just of intent, but a determined desire to demonstrate adherence to the standards. In turn, it is a signpost to help users make good choices on whether to use the data.

An analyst’s job is never done

‘Don’t trust the data. If you’ve found something interesting, something has probably gone wrong!’ Maybe you’ve been there too? It was a key lesson I learnt as a junior researcher. It partly reflected my skills as an analyst at the time – the mistakes could well have been mine! But, not entirely.

You see I was working with cancer registration and deaths data which on occasion could show odd patterns due to changes in disease classifications, diagnosis developments or reporting practices. Take a close look and you could spot the step changes when a classification change occurred. Harder to spot might be the impact of a new treatment or screening programme. But sometimes there were errors too – including the very human error of using the wrong population base for rates.

I was reminded of this experience when Sir Ian Diamond, the National Statistician, spoke to the Health and Social Care Select Committee in May. He said (Q34):

“One of the things about good statisticians is that they are always just a little sceptical of the data. I was privileged to teach many great people in my life as an academic and I always said, “Do not trust the data. Look for errors.””

Sage advice from an advisor to SAGE!

The thing with quality is that the analyst’s job is never done. It is a moving target. In our Quality Assurance of Administrative Data guidance, we emphasise the importance of understanding where the data come from, how and why they were collected. But this information isn’t static – systems and policies may alter. And data sources will change as a result.

Being alert for this variation is an ongoing, everyday task. It includes building relationships with others in the data journey, to share insight and understanding about the data and to keep a current view about the data source. As Sir Ian went on to point out in his evidence, it should involve triangulating against other sources of data.

OSR recently completed a review of quality assurance in HMRC, at the agency’s invitation. It was a fascinating insight into the operation of the organisation and the challenges it faces. We used a range of questions to help inform our understanding through meetings with analytical teams. They told us that they found the questions helpful and asked if we would share them to help with their own quality assurance. So, we produced an annex in the report with those questions.

And we have now reproduced the questions in a guide, as prompts to help all statistics producers think about their data and about quality under these headings:

  • Understanding the production process
  • Tools used during the production process
  • Receiving and understanding input data
  • Quality assurance
  • Version control and documentation
  • Issues with the statistics

The guide also signposts to a wealth of excellent guidance on quality on the GSS website. The GSS Best Practice and Impact Division (BPI) supports everyone in the Government Statistical Service in meeting the quality requirements of the Code and improving government statistics. BPI provides a range of helpful guidance and training.

  • Quality Statistics in Government guidance is primarily intended for producers of statistics who need to ensure that their products meet expectations for statistical quality. It is an introduction to quality and brings together the principles of statistical quality with practical advice in one place. You will find helpful information about quality assurance of methods and data and how to design processes that are efficient, transparent and reduce the risk of mistakes. Reproducible Analytical Pipelines (RAP) and the benefits of making our analysis reproducible is also discussed. The guidance complements the Quality Statistics in Government training offered by the GSS Quality Centre.
  • Communicating quality, uncertainty and change guidance is intended for producers of official statistics who need to write about and communicate effectively information about quality, uncertainty and change. It can be applied to all sources of statistics, including surveys, censuses, administrative and commercial data, as well as estimates derived from a combination of these. There is also a Communicating quality, uncertainty and change training.
  • The GSS Quality Centre has developed a guidance which includes top tips to improve the QA of ad-hoc analysis across the GSS. Moreover, the team runs the Quality Assurance of Administrative Data (QAAD) workshop in which users can get an overview of the QAAD toolkit and how to apply it to administrative sources.
  • There is also a GSS Quality strategy in place which aims to improve statistical quality across the Government Statistical Service (GSS) to produce statistics that serve the public good.

Check out our quality question guide and let us know how you get on by emailing me at penny.babb@statistics.gov.uk – we would welcome hearing about your experiences. We are always on the look-out for some good examples of practice that we can feature on the Online Code.

National Statistics Designation Review

Penny Babb, Head of Policy and Standards in the Office for Statistics Regulation, focuses in on the benefits of hearing others’ perspectives during our review of the National Statistics designation.

It’s good to talk – and listen

One of the things that I have enjoyed most about the work we have done so far in reviewing the National Statistics designation is to sit in on a couple of focus groups with members of the public. It was fascinating to hear about how important data are in their lives and the choices they make. And, also, their reflections about official statistics and National Statistics.

All of us can fall into the jargon trap. We strive to communicate succinctly but there can be a danger in every day words being used in very specific, narrow ways. That is true in our world of official statistics.

The focus groups asked some important questions:
What does ‘national’ mean? Is it a country? Which one?
What’s official? Is it when some company or school has released its official figures?
OK, the Code has the standards they must work to – how do you know they are doing what they promise to do?
So, the badge means that someone is checking?

While there were many questions, there was no doubt that it matters that official statistics use standards that are widely accepted and adopted. And, very importantly, are seen to have been applied. That means being able to show clearly that the Code standards are being met.

One sobering reflection was to underscore the findings of the Public Confidence in Official Statistics surveys – independence of statistical production and release matters hugely to users of the information. Trust was low in politicians, but confidence was high in the people producing the statistics.

The focus groups and roundtable discussions also highlighted that people want to understand whether the numbers are OK for them to use for their own purposes. That is a challenge for all of us working in official statistics – finding the ways to communicate clearly and meaningfully about the suitability of the data.

And that is something I am looking forward to beginning to tackle in the second part of our project over the coming year. We’ll be working with a wide range of experts and drawing on the knowledge and views of stakeholders across the spectrum, to ensure that National Statistics are the asset we all need them to be.

See the National Statistics Designation review in full.

Experimental statistics – myth busting

Penny Babb, head of policy and standards in the Office for Statistics Regulation, busts a few myths about experimental statistics.


I reckon that experimental statistics are probably one of the least understood aspects of official statistics among producers. But, you may say, they’ve been around for nearly 20 years! So perhaps familiarity breeds contempt? There may be something in that. But in this blog, I’d like to correct a few myths about experimental statistics and leave you with the sense that these are cutting edge statistics – they are at the heart of innovation in official statistics.


“ES is a mark of poor quality” – WRONG!

‘Experimental statistics’ means that the statistics are going through development and evaluation.

Going through a process of development will certainly mean that there is a greater potential degree for uncertainty in the estimates.

But done correctly (that is, explaining clearly about the nature of any important limitations when publishing the experimental statistics) should mean that they are useful to users. If they aren’t, perhaps you shouldn’t be publishing them.


“You can just tell users about what you’ve done after you done it” – oh no you can’t!

The best way to test new methods or sources of data is to do so openly and in collaboration with users and other producers.

You build confidence in the statistics by being open and clear about the developments. That involves setting out the nature of both the development and evaluation.

Share your plans. Be clear about when users can be involved. Learn from their expertise and experiences. Understand what questions they want the statistics to answer, and how they use the data and statistics to answer those questions.

Feed their ideas and experiences back into your development. Your statistics will be the better for it and you will have earned credibility with those who know your statistics best – your users.


“The ES label can be used as long as you like” – absolute no, no!

The label of experimental statistics should only be used while the development and evaluation are happening.

If the same method and data are being routinely used to produce some supposed experimental statistics but there is no actual development, and instead the label is being used to indicate that the method or the data are a bit rough, then stop using the experimental statistics label.

Instead, you should be labelling the statistics as official statistics and be making clear the nature of the strengths and limitations – if there is a quality issue that users need to know about, then tell them. But don’t do it by labelling your output as experimental statistics.


“ES is only for official statistics and isn’t relevant to National Statistics” – oh yes, it is!

It is imperative that National Statistics continue to reflect the aspect of society that they represent – without these kinds of developments, there is a risk that statistics do not remain relevant. We had a good reminder of the dangers of that in the Bean review of economic statistics.

And here’s a great current example. MHCLG’s team producing land use change statistics is undertaking a development that draws on cutting-edge technology – earth observations from its partners at Ordnance Survey. The team has developed a good understanding of the insights that users need around land use and the change in use. So, when the statisticians identified a new source of data, they jumped at the chance to improve their National Statistics. Check out the work of Sophie Ferguson and her team on the GOV.UK website.

“Publishing an experimental official statistic alongside our consultation gave us an opportunity to provide proof of concept. The data had not been published before and as an experimental official statistic we had a clean slate to demonstrate how, using the latest technology, we might enable the user to control how they interact with the data, and get better insights more directly.”
Sophie Ferguson, lead statistician, Land Use Change Statistics, MHCLG


Please write to me at regulation@statistics.gov.uk if you have any comments, queries or good examples about experimental statistics – or if you have other myths that you would like busted!

It will be great to hear from you.


Related links:

Regulatory guidance on experimental statistics

GSS GPT guidance on experimental statistics

A Public Listing: Committing to Trustworthiness, Quality and Value

Penny Babb explains how organisations can voluntarily apply the pillars of the Code of Practice for Statistics.

New year’s resolutions can be easily made and even more easily forgotten. The three pillars of the Code of Practice provide all analysts with a memorable focus for their work. Repeat after me: Trustworthiness, Quality and Value!

It is hard to believe that it is nearly a year since we launched our refreshed Code of Practice. Our Code website is proving a successful aid for statistics producers and we are seeing a growing interest in the voluntary adoption of the Code’s pillars. It was great to meet with 11 organisations at the beginning of December – our first step towards creating a ‘community of practice’. It provided an opportunity for new adopters to share their experiences of voluntarily applying the pillars with others considering it. Exciting times!

A List of Voluntary Application

We have just launched a list of the organisations that have made a public commitment to Trustworthiness, Quality and Value, by publishing a statement of compliance that shows how they demonstrate the pillars. We are in touch with a range of other organisations that are working on adopting the Code pillars and we expect to add to the list in the coming months.

If you are interested in voluntarily applying the Code pillars, you will find it helpful to look at the statements of compliance available through the List – they reflect the variety of situations in which the statistics are being produced.

Making a commitment

Here are my suggestions for what it looks like to commit to the pillars of the Code:

Organisations and analysts can commit to demonstrating their trustworthiness:

  • by behaving with integrity and professionalism
  • having effective business processes and being accountable for decision making
  • by respecting the security and confidentiality of people’s information

Organisations and analysts can commit to ensuring quality by using data and methods that produce assured statistics:

  • using appropriate data to meet the intended uses
  • using the best available methods and being open about their choices
  • ensuring that the data and statistics are quality assured and as robust as possible

Also, organisations and analysts can commit to delivering value in their analysis and statistics by:

  • placing users at the centre of analysis and statistical production
  • producing statistics that are useful, easy to access, relevant and provide insight for the intended audiences
  • seeking to improve their statistics through collaboration and efficiency

Applying the three Code pillars can help any analyst to produce outputs that are well respected, high quality, and useful. Why not start the year as you mean to go on?

Feel free to contact us if you have any questions about the statement of compliance or voluntary application in general.

A matter of fact

How to get on and influence people or what you need to know if you want to be part of important policy decisions.

Penny Babb, Head of Policy and Standards in the Office for Statistics Regulation, describes how thinking about Trustworthiness, Quality and Value can help policy professionals in their careers.

Policy professionals are at the heart of designing and delivering the work of government. Your judgement about evidence is crucial in developing sound policies and understanding their implications and impact. To be able to effectively assess evidence and advise on solutions, your decisions need to be based on more than just instinct – a gut reaction to what sounds like a great idea can lead to millions of pounds of public money being wasted. But get it right and you can transform the lives of millions of people in the UK.

How do you know what evidence you can trust, or decide if the figures are reliable or are the ones you need?

Keep it simple and consider three things: Trustworthiness, Quality and Value.


Trustworthy

Ask who produced the figures – how do you know you can trust them in the way that they produce their figures and use data?

Quality

What is the quality of the data and how robust are the methods? How sure can you be about the evidence?

Value

Do the figures measure what you are interested in? Can you make sense of the patterns and trends?


Trustworthiness, Quality and Value are the fundamental pillars of the Code of Practice for Statistics. The Code sets out what you as users can expect from the producers of official statistics, and the standards they should work to, to ensure that you can have confidence in their statistics.

The pillars are useful for other data, statistics and analysis, going beyond official statistics. For example, they are being applied by analysts in Department for Work and Pensions and by the Greater London Authority.

You can also apply the pillars in your own work. Think about when you produce ministerial advice, and ask yourself how the Minister can have confidence in your briefing:

  • How have you demonstrated your trustworthiness in the way that you have organised and managed the information?
  • How reliable is your evidence and how certain are you about your conclusions?
  • How have you provided value in your advice?

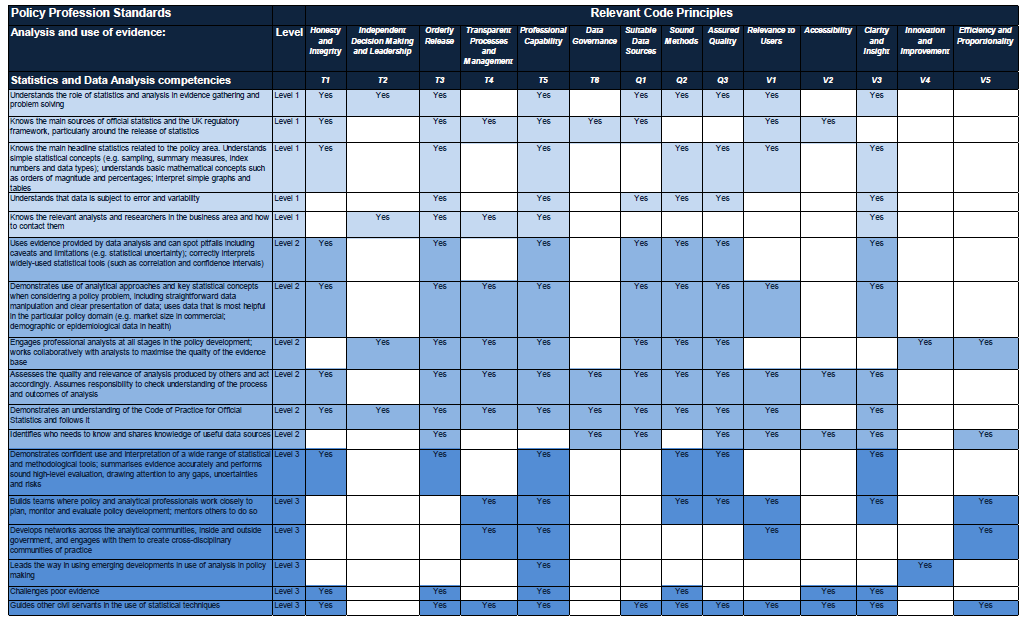
The Policy Profession Standards includes competencies related to statistics and data analysis under Evidence – Analysis and use of evidence.

Applying the Code pillars can help you succeed as a policy professional by developing and demonstrating your analytical skills and so providing impartial, well-considered advice based on sound evidence.

The Office for Statistics Regulation produced the Code of Practice for Statistics. We have mapped the principles in the Code to the competencies in the Policy Profession Standards for each of the three professional levels. Use this matrix to see which parts of the Code can help you develop your skills­­ in for statistics and data analysis at each competency level.

Select the image below to download a PDF version:

Select this image link to download a PDF version


The Good Practice Team (GPT) in the Government Statistical Service has published a booklet with ten things you need to know about statistics, aimed at policy professionals across central government. It introduces some key ideas and concepts to help you to ask the right questions about data and statistics.