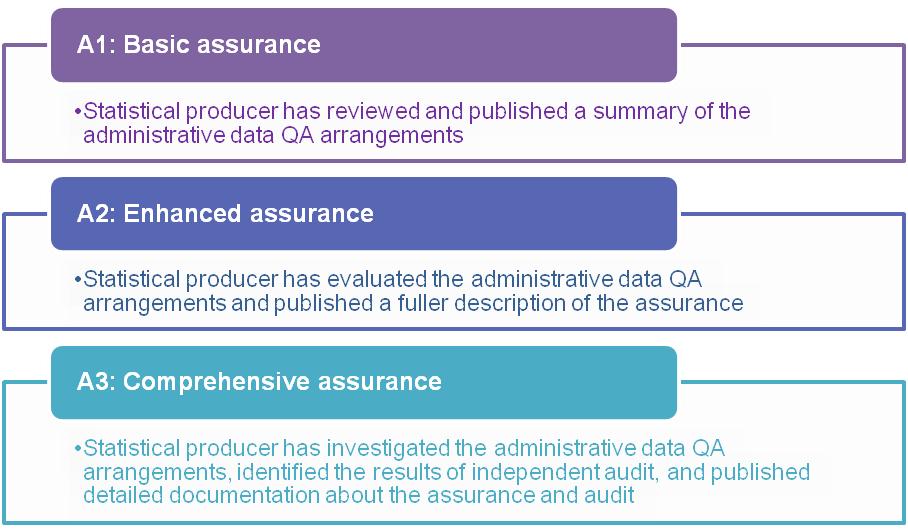
The QA Matrix helps assessors and producers to determine the types of assurance and documentation required to inform users about the quality assurance arrangements for administrative data.
This guidance can support decisions about the suitability of the data and to identify examples of practices that meet the different levels of assurance.
The need for investigation and documentation increases at each level of assurance from ‘Basic’ (A1) to ‘Enhanced’ (A2) to ‘Comprehensive’ (A3).
The assurance levels in the QA matrix are not intended to be interpreted as a RAG status (red/amber/green) commonly used in project management.
Level A3 does not necessarily mean that remedial action is needed; instead it could mean that the statistics have ongoing levels of higher public interest and higher quality concerns which would mean that higher levels of assurance would be continual.
Remaining at A3 level of assurance over time does not represent a failing by the statisticians; it simply demonstrates that a higher level of assurance is necessary for a certain set of statistics.
It may be appropriate for the levels of assurance to vary among the four practice areas; for example, given specific circumstances it may be appropriate for ‘Communication’ to be Basic (A1), while ‘Data Collection QA’ be Enhanced (A2) and for both ‘Operational Context’ and ‘Producer’s QA’ to be Comprehensive (A3).
Official Statistics examples applying the levels of assurance
NISRA, Driver & Vehicle Agency Branch, DOE Driver, Vehicle Operator and Enforcement Statistics (Northern Ireland)
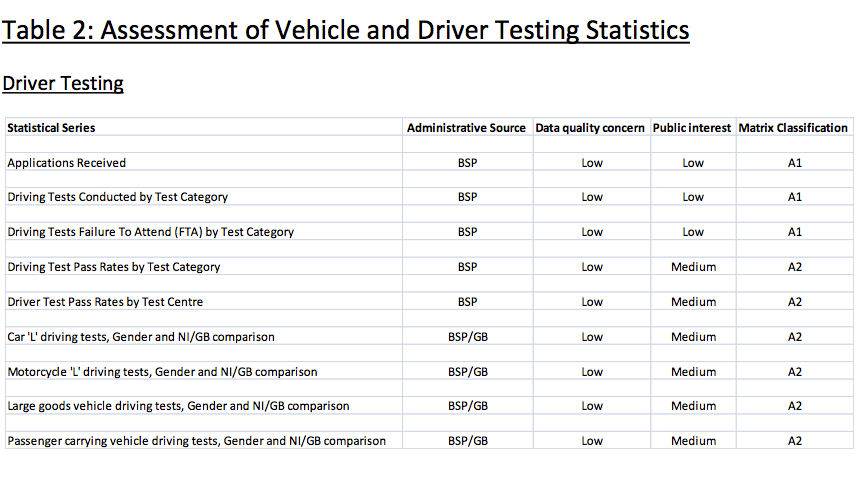
The DVA Branch reviewed the levels of assurance for each of the administrative data sources used to produce the DOE Driver, Vehicle Operator and Enforcement statistics. Its data quality assessment provides the rationale for its selection.
It describes the data sources in relation to each of the four practice areas:
- operational context and administrative data collection
- communication with data suppliers
- quality assurance principles, standards and checks by data supplier
- producer’s quality assurance investigations and documentation
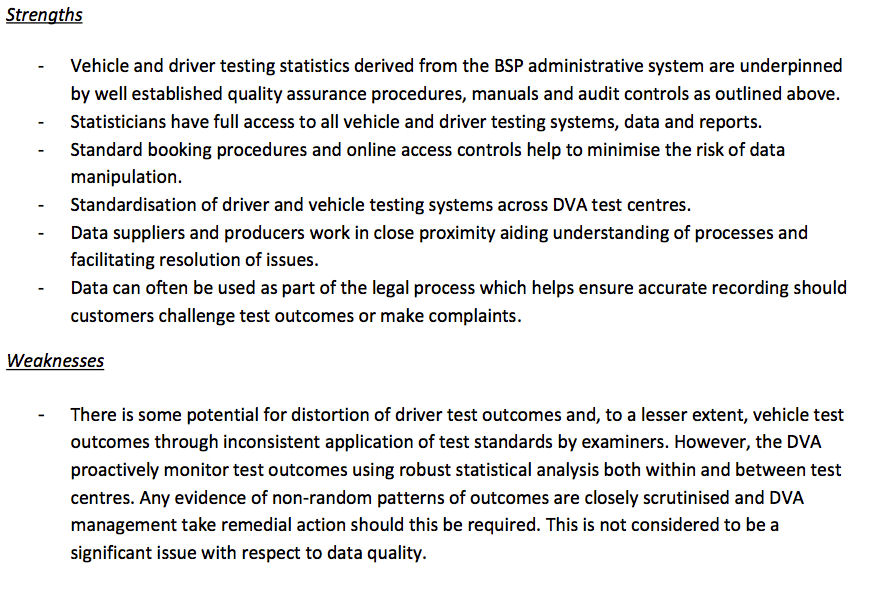
It then summarises the strength and weaknesses of each data source, describing the implications for the statistics.


