Five top tips
Here are five issues to watch out for when conducting your own quality assurance of administrative data: 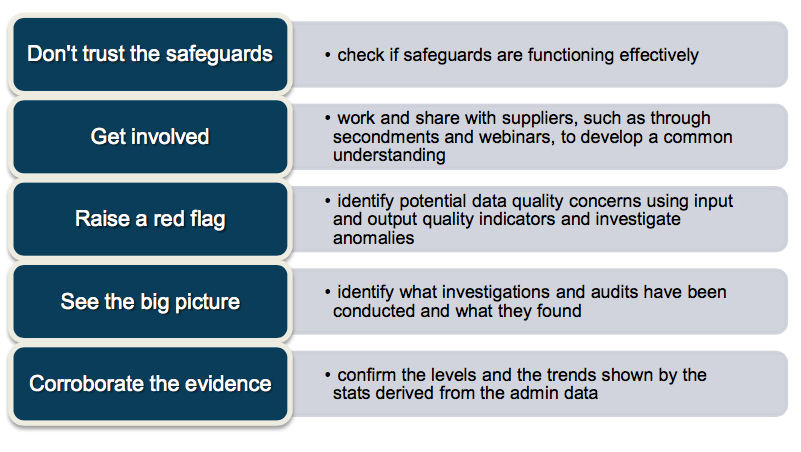
Statistical producers conduct their own quality assurance
Quality assurance checks should consider whether the derived statistics are meaningful, and whether changes in trends and discontinuities can be explained. Look to see whether there have been any changes in target definitions or the operational system, and what their implications may be for the statistics.
The checks conducted on data received from data suppliers are well established and represent the main body of work undertaken by producers to verify the validity of the data prior to use in producing official statistics. These can include generating quality indicators, such as:
- results of checks on the completeness and coverage of the data items and the nature of missing values
- estimates of the completeness of the target population
- consistency measures such as comparing the counts of key variables with previous data sets
- process indicators – eg scale of imputation and estimation
Since QA checks on the received data cannot, by themselves, determine the accuracy (i.e. how closely the data represents the true value) of the administrative data, producers should seek additional information. They should corroborate their QA findings against data from other sources, such as surveys or other administrative data sources, and compare rates or proportions with the other data sets.
Statistics producers should summarise its findings from the quality assurance checks, to set out the basis of the producer’s judgment about the quality of the administrative data and highlight for users any pertinent issue that may influence their understanding of the statistics.
This statement also should be informed by the review of the other practice areas identified in the QA Matrix (Operational Context, Communication with data supply partners, and Data Suppliers’ QA arrangements) and any relevant investigations undertaken by, or on behalf of, external bodies such as regulators, auditors, or by professional bodies.
Guidelines for Measuring Statistical Output Quality
The GSS Quality Centre in ONS has published a comprehensive list of the range of checks that can be carried out on administrative data and for survey data.
Advice from International Statistical Organisations
ESS Quality Assurance Framework
Eurostat emphasises the importance of providing quality reports to accompany official statistics, describing how each dimension is met. It has produced guidance to NSIs on the content of quality reports. The ESS Quality Assurance Framework (ESS QAF) describes different dimensions of quality:
- relevance
- accuracy and reliability
- timeliness and punctuality
- accessibility and clarity
- comparability and coherence
Accuracy denotes the closeness of computations or estimates to the true values. The accuracy section in quality reports should describe the methodology used, identify the key variables and the main sources of random and systematic error of the statistics. An assessment of bias can be either described in quantitative or qualitative terms. It should set out the main sources of potential bias and reflect actions taken to reduce bias.
ESS QAF identifies some of the quality indicators that can be produced for administrative sources:
- Coverage, i.e. over- or under-coverage of the population that should have been included according to the definition or classification used
- Errors in register variables – similar to measurement error in a survey with errors occurring during the data collection
- Rate of unreported events in event-reporting systems
ESS QAF recommends the preparation of a quality assurance plan in which statistical producers should:
- Assure the quality of data collection, including the use of administrative data
- Ensure the systematic examination of possible trade-offs within quality
Appropriate validation rules should be used for both statistical and administrative data processing with specified procedures for checking quality, when using the administrative data for statistical purposes.
There’s a need to carry out the regular updating of business registers, to ensure that the register reflects the changes in the population of businesses and to conduct external evaluations of the methods used with external experts.
Similarly it is vital to ensure that changes to the target population are understood and accounted for, such as when policy changes widen or narrow the range of eligible recipients of particular benefits.
The QA plan should also include quality reviews such as self-assessment for statistical outputs such as through the conduct of peer reviews on the statistical outputs.
US Data Quality Assessment Tool for Administrative Data
The US Federal Committee on Statistical Methodology, the US Census Bureau, has also developed a tool to assist in the assessment of the quality of administrative data. Its Data Quality Assessment Tool for Administrative Data provides a set of questions that can aid data providers in evaluating the quality of its administrative data, as well as assisting users (or the statistical producers) in determining the suitability of the data for an intended use.
The tool comprises 43 questions to prompt the investigation of the data quality. It also uses a quality framework, with six dimensions: relevance, accessibility, coherence, interpretability, accuracy and institutional environment. ‘Accuracy’ has the same meaning as used in the ESS QAF. In relation to the assurance and audit of the underlying administrative data the US tool specifically asks:
- What investigations/analyses have been conducted that reveal data quality characteristics (such as Government Accountability Office reports, Office of Inspector General audits, internal agency reviews etc)
- Describe the checks the administrative agency performs to ensure the quality of the data and the typical results for your production processes
- Describe the principles, standards, or guidelines the agency uses as a basis to determine what is considered acceptable quality
- Describe the findings and corrective actions of studies, evaluations or audits to assess compliance with quality standards
The US tool highlights the information that official statistical producers can obtain about the underpinning administrative data sources, to better understand the quality implications for the statistical outputs.
‘Hyper-dimensions’ of Quality: Source, Metadata and Data
Statistics Netherlands has developed a quality framework and checklist for NSIs to apply to administrative data sources.
It highlights three ‘hyper-dimensions’ of quality: Source, Metadata and Data.
- ‘Source’ reviews the quality aspects of the data source as a whole, the data collection organisation and the delivery of the data to the statistical producer. The detailed dimensions are: supplier, relevance, privacy and security, delivery and procedures
- ‘Metadata’ describes the quality aspects relating to the information required to understand and use the data: clarity, comparability, and data treatment by the data source keeper
- ‘Data’ involves quality aspects that are mainly related to the accuracy of the administrative data such as over-coverage, under-coverage, unit non- response, item non-response and measurement – which includes activities such as ‘external check: has an audit or parallel test been performed?’
It developed a checklist to assist NSIs in the assessment of the quality of the administrative data sources that covers the first two hyper-dimensions which both include some aspects of the assurance arrangements of data suppliers. The information is mainly captured through a structured study of data quality indicators under the ‘Data’ hyper-dimension.
Statistics Netherland’s tool has informed the development of a quality indicator instrument as part of the ESS network (‘ESSnet’) project on administrative data focusing on business and trade statistics. It is intended to be used by NSIs in routinely verifying the quality of administrative data received from data suppliers, and includes indicators for each of the ESS quality dimensions.
The quality indicator instrument will be useful for statistical producers conducting their own quality assurance of the data received from suppliers, particularly in highlighting possible errors for further investigation.
The ESSnet project also identified checks to be conducted when first considering the use of an administrative data source for producing official statistics.
The indicators highlight the need to be clear about what is needed from the statistical use of the data and to build a comprehensive understanding of the administrative source.
They suggest that producers compare definitions between the need and the source, and determine the coverage, such as geographical area, reporting delays, and thresholds in size or quantity.
Producers can also contact data suppliers and seek expert opinion from those managing the collection process, to become acquainted with practical aspects of the collection.
The project also emphasises the benefits of comparing with other data sources, to gain a more objective view, particularly with a trustworthy source. It may be possible to use methods such as capture-recapture procedures to estimate duplicates in the administrative data.
Visual inspection also will enable outliers and/or processing errors to be identified, through charting the data and making comparisons of distributions.